Browser Rendering Optimization
<– back to Mobile Web Specialist Nanodegree homepage
9. The Critical Rendering Path
9.1 Course Introduction
Hi I’m Paul Lewis and I’m a Developer Advocate at Google. And I’m Cameron Pittman. I make front end web development courses here at Udacity.

We’re here to help you develop apps that run at a silky smooth 60 frames per second. And you may think it’s just JavaScript that you need to worry about but there’s actually a lot more to it than that. This course is about changing the way that you approach performance issues. We’re going to help you look at the bigger picture.
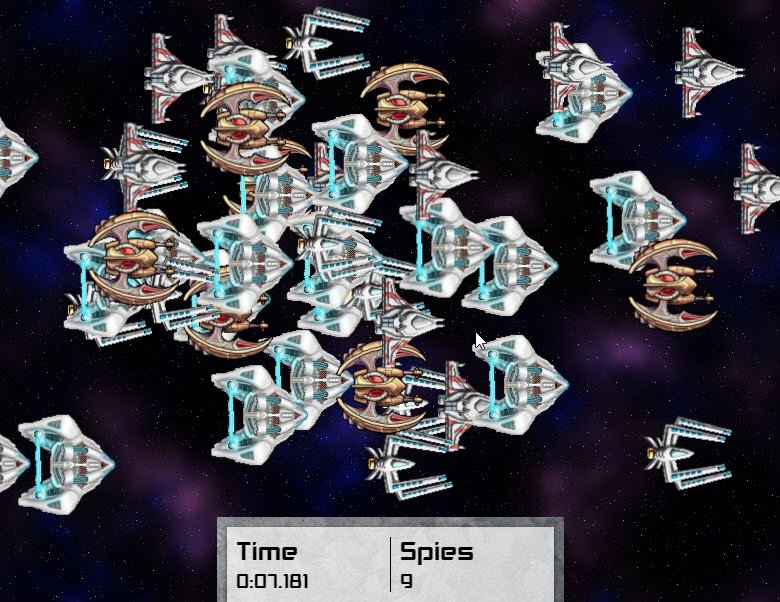
Okay let’s play a game.This was made by my colleague Jake Archibald and it’s designed to show off problems with frame rates and performance on the web.

See these ships at the top? They move smoothly. The ones at the bottom judder. The game is super simple; shoot the juddering ships as quickly as you can by clicking on them. You’re going to have to spot them amongst the smooth ones.
9.2 Jank Invaders
Link to Jank Invaders Game
9.3 Lesson Intro
Throughout this course you’ll be working on a bunch of samples with performance issues. But by the end of the course, you’ll be applying what you’ve learned to make silky, smooth experiences.
But first, in order to develop an app that runs at 60 frames per second, you need to understand what goes into creating each frame.
In this lesson, you’ll be getting the background knowledge that you need about the browser’s rendering pipeline.If you’ve taken web performance optimization with Ilya Gregorich and me, this will seem pretty familiar.
The point of this lesson is to help you experience what potential bottlenecks may slow down rendering.
In the next lessons, you’ll be diagnosing and solving common performance issues, as well as getting a sense for how to approach performance at different stages in your app’s life cycle.
9.4 Juddering
Avoiding jutter is extremely important to users. You just saw what a difference it made in Jank Invaders just now. But, it’s not just games. It can affect all sites and web apps.
Let’s put that in the context of native apps a second. Think about what you do when you’re choosing between two native apps that do the same kinds of things. How do you decide between two?
Well, I’ll look at reviews and see what people say about the app’s features and, you know, I’m also interested in performance. A quick look around poorly rated apps tells you that users notice and they care when an app judders or stops for,like, one to two seconds whenever I click on this thing.
When that happens they, and you, would choose an app that performs better and it’s no different with the web.
Bad performance kills good sites. Equally, users love experiences that are smooth, that stick to their finger and react quickly. Another colleague of mine Paul Kinlan ran a survey about the features that people want from a news app. And the most requested feature was smooth navigation. Smooth, as in, no jank. In fact, 77% of people wanted it.
This course will explain how you can think about your project’s performance and what tools you have at your disposal, and what you’re looking for and how to fix common issues. You’re going to hunt down causes of sticky scrolling, flickering updates, and juttering animations.
But first, you’ll start your 60 frames per second journey by exploring what goes into a single frame.
9.5 Frames
If there’s any kind of visual change on screen, from scrolling to animations, the device is going to put up a new picture, or frame, onto the screen for the user to see.
Most devices today refresh their screen 60 times a second, which we measure in hertz. And so to match that we need to have 60 frames to put up.
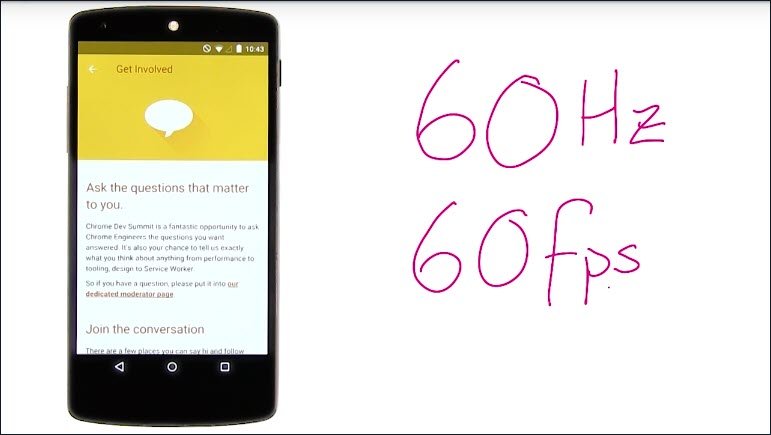
Most of the time we’ll refer to this as 60 frames a second or fps.
People are especially good at noticing when we miss one of these frames. And they don’t like it. Think of how easy it was to spot in Jank Invaders. If the browser is taking too long to make a frame, it will get missed out. The frame rate will drop and users will see stuttering. If it’s really bad, then the whole screen can lock up, which is the worst.
9.6 Quiz: ms Per Frame

9.6 Solution
I’ll take 1000 milliseconds and divide it by 60 frames per 1000 milliseconds and I’ll get about 16 milliseconds per frame.
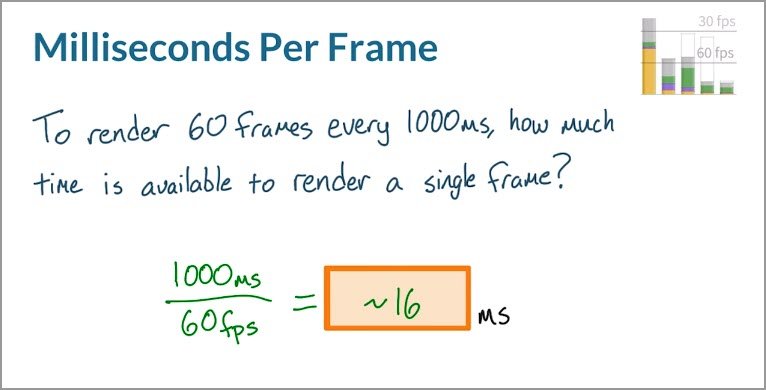
This means that in order to achieve a silky smooth 60 frames per second, you need to keep all of the work in making the frame under 16 milliseconds.
But actually, the browser also has some housekeeping work to do in every frame. So realistically, you have somewhere in the region of 10 to 12 milliseconds to get everything done and make sure the frame arrives on time.
9.7 What’s in One Frame
You can’t optimize your app’s frame rate if you don’t understand how the browser actually renders a frame. So you need to learn how a page is actually put together when it’s first loaded.
Okay, so let’s take a look at what goes into making a frame.
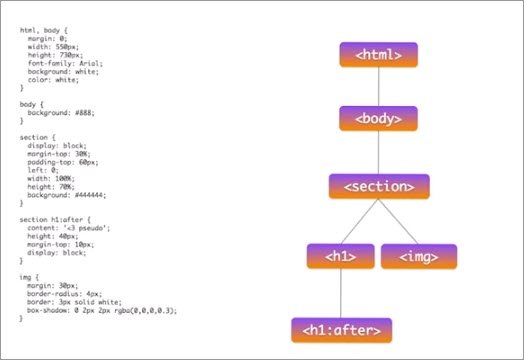
Initially the browser makes a GET request to a server. The server responds by sending some HTML.
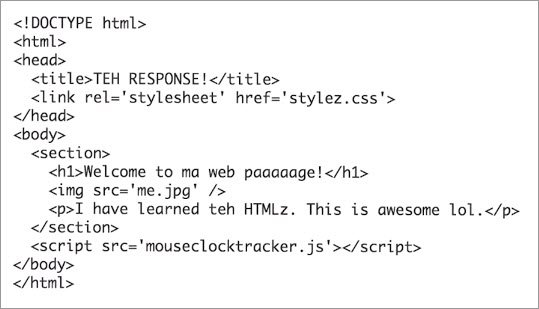
At this point, the browser does some pretty clever stuff with lookahead parsing. But what we care about is that it parses the document and gives us these notes.
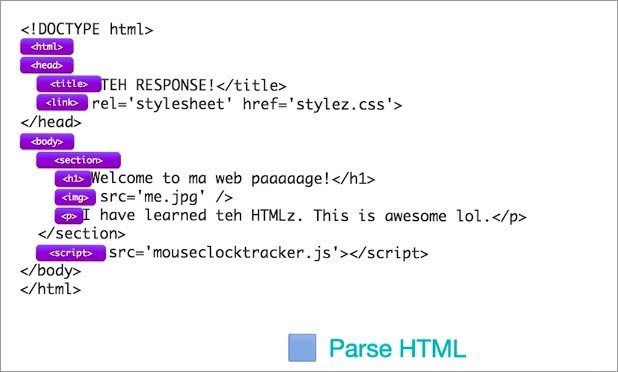
In Chrome DevTools, you’ll see it as Parse HTML.
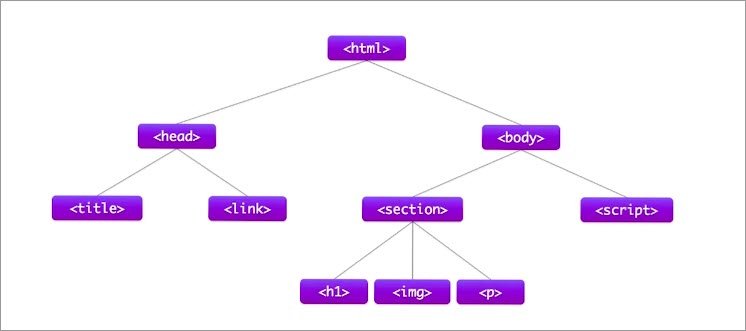
Okay, so this is what the DOM looks like as a tree. But let’s just make it a bit easier for ourselves, and call it the DOM.
As well as the DOM, we also have CSS. And this comes from the user agent, it comes from your style sheets or any inline styles you have, and perhaps third party styles.
The next part of the process is to combine the DOM and CSS.
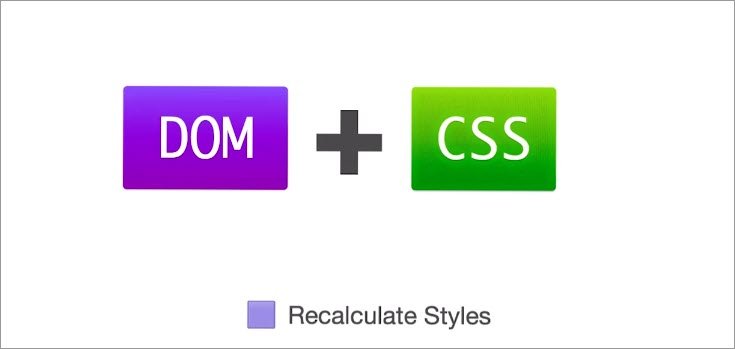
In the tools you’re going to see this as Recalculate Styles.
When combined, we get a new tree called the Render Tree.

The Render Tree looks pretty similar to the DOM, except that some things are missing.
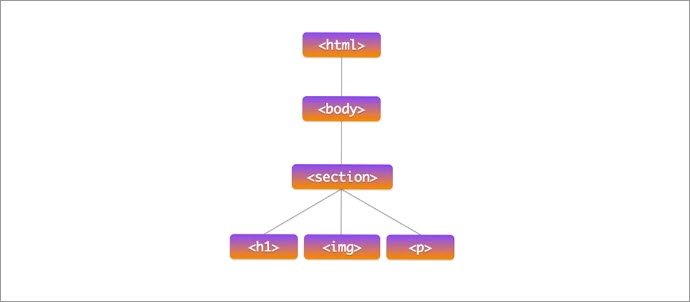
For example, we don’t have the head anymore, we don’t have any scripts. In fact, if we had some CSS that set the section paragraph to display: none, then it would be removed from the render tree.
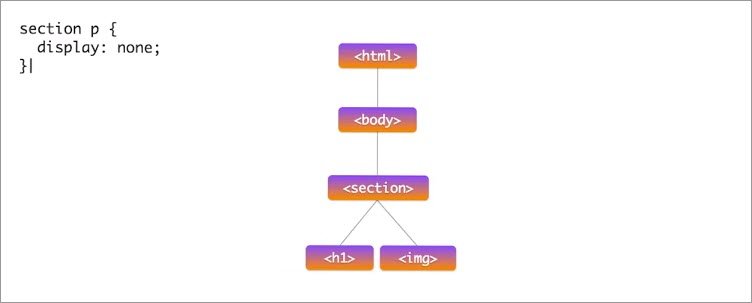
Equally if we had some CSS that added a pseudo element like after or before, this would get added to the render tree even though it doesn’t live in the DOM.
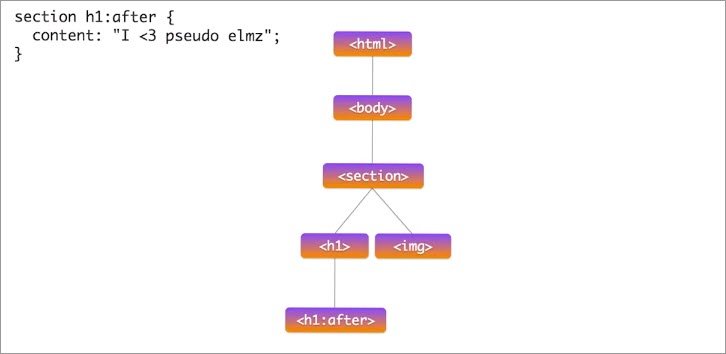
It’s important to note that only elements that will actually be displayed on the page will make it into the render tree.
So this is essentially a simplified view of where the critical rendering path optimization gets you.
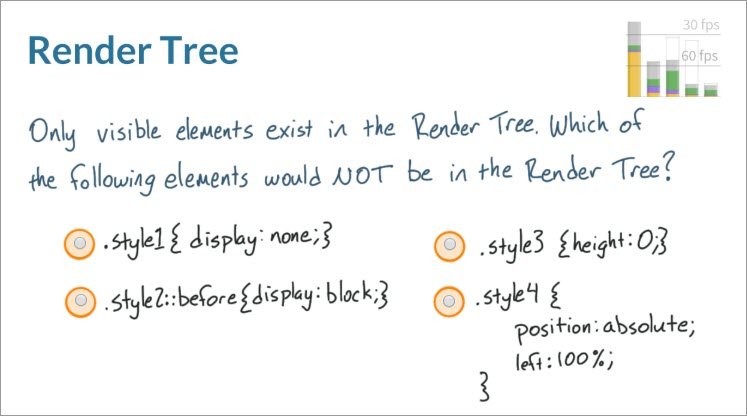
9.8 Quiz: Render Tree
9.8 Solution
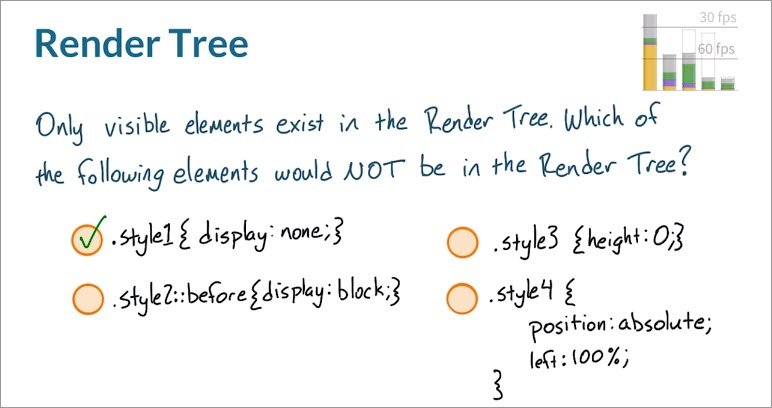
And the correct answer is any element with a class of style none.
If an element is set to display none that means that the element is not going to be rendered whatsoever. For the other three options, though they may not take up any space on the page that you’re seeing they’re still a part of the page. Which means that the browser will still put style three, style four, and style two before on the render tree.
In order for .style2 to end up in the render tree, it needs to have some content, like ‘’ assigned to it.
9.9 DOM & Render Tree
Okay, back to the rendering process of a single frame.
Once the browser knows which rules apply to an element, it can begin calculate layout. Or it, in other words, how much space elements take up and where they are on the screen.
So, here’s all the CSS that we want to apply. And layout turns this tree
into a collection of boxes like this.
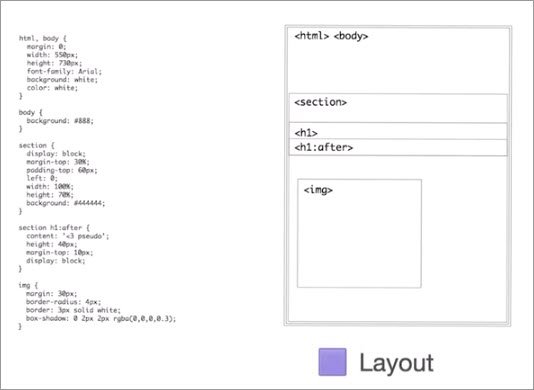
In the tooling, you’ll see this as layout.
The web’s layout model means that one element can affect others. So, for example, the width of body typically affects the children’s widths and so on, all the way down the tree. So the process can be quite involved for the browser. Sometimes, you may hear layout called reflow. It’s the same thing.
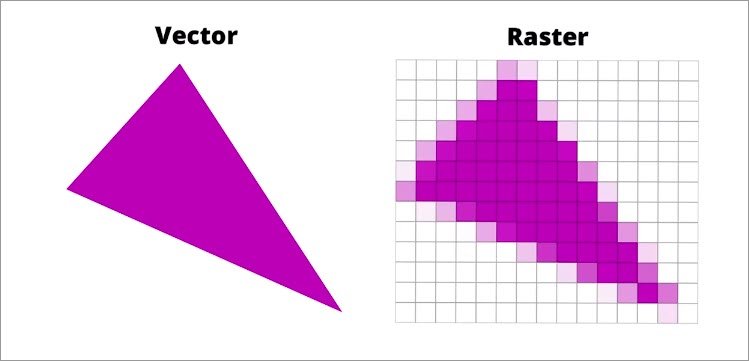
The next step in the process is to talk about vector to raster. For example, the boxes we had before were vectors like this, just shapes.
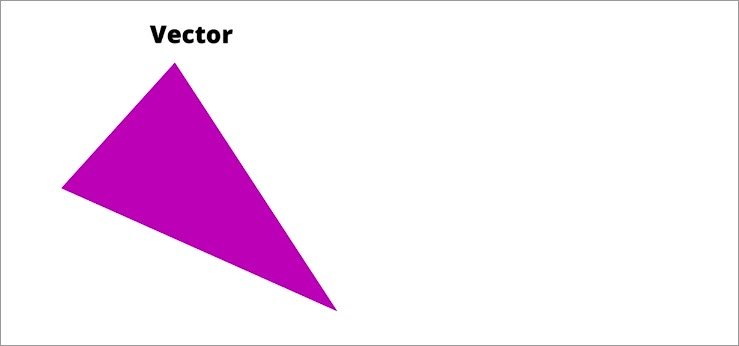
But now what we need to do is fill in individual pixels, like this. And that’s what a rasterizer is for.
So, this is the layout we had before, and these are the draw calls that the rasterizer will make to fill it in.
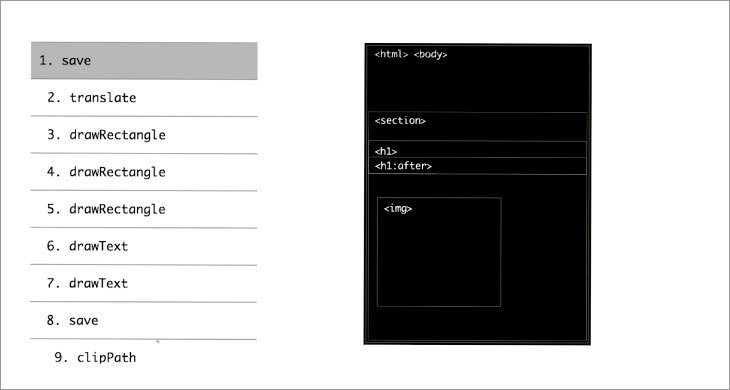
When done, it will look like this.

But that’s a little too quick, so let’s step through and see it build up the picture bit by bit.
So you can see, these rectangles start to appear, then some text.
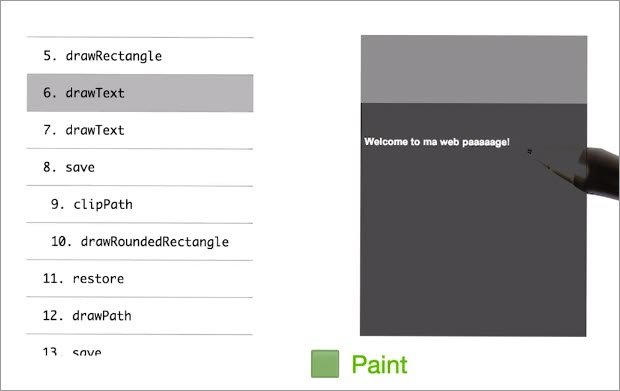
And we get a shadow, a white line, a picture, and finally it tightens up.
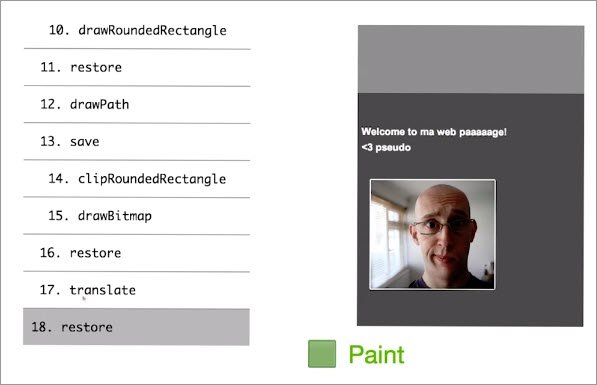
The tooling is going to show you this as paint.
You may have noticed in that previous list that one of the calls was called drawBitmap. What we normally do is we send things like JPEGs, orPNGs or GIFs down the wire to our page. But what the browser has to do is decode these into memory, like this.
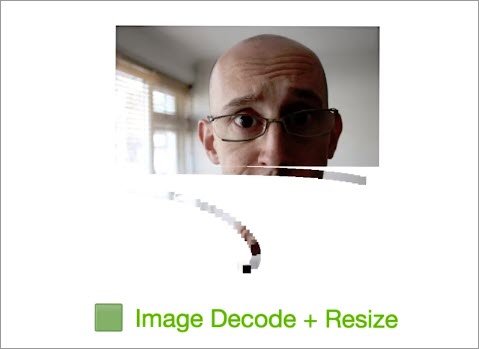
In the tooling, you’ll see it as Image Decode. Potentially, we’re doing something like responsive web design. And so the image may also need resizing.
Painting, as you may have noticed just now, was done into a single surface. However, sometimes browsers make multiple surfaces called layers or compositor layers and it can paint into those individually.

So here I have a site and this masthead has its own layer. That means we can paint the content behind. And we can paint the masthead itself.

The process of handling these layers is shown in the tooling as composite layers.
This masthead is a layer, but because we have buttons for next and previous on top of it they are also turned into layers as well.

In this course, we’re going to talk about layer management to make sure that you don’t create extra layers by accident.
Now, we can put all these layers back together. And so now we’ve finished painting all the layers for our page. To be honest, painting actually happens into a grid of tiles like this.

I mentioned it for completeness, but it’s not something we get to control as developers. All of this happened on the CPU. The layers themselves and their tiles will be uploaded to the GPU.
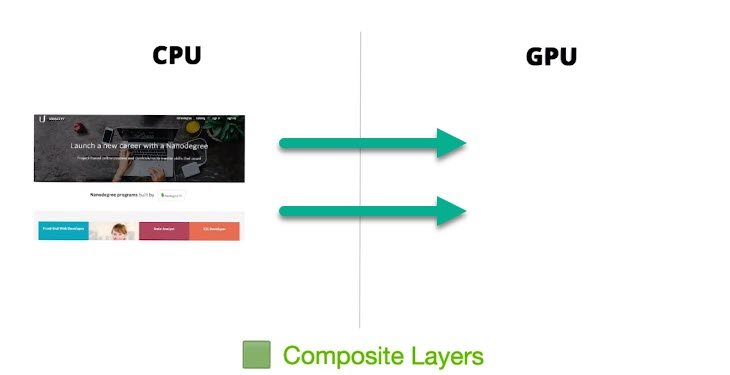
Again, this will be included in composite layers. And lastly, the GPU will be instructed to put the pictures up on the screen.

And that, in brief, is how we get from a single request all the way through to pixels on screen.
9.10 Quiz Layout
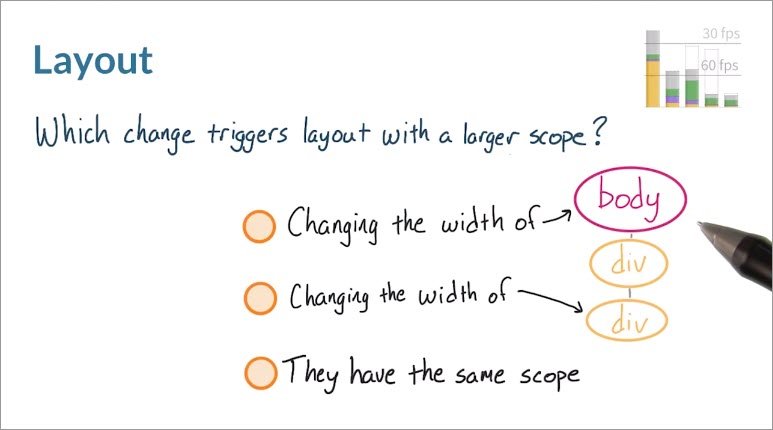
For this quiz, I’m giving you a sample DOM, there’s a body with a div container underneath it. And then a child div underneath the container.

If you make changes to the geometry of any of these elements, the browser will have to run layout. So, my question for you is, which of these elements, will when changed, include more of their parent elements in the scope of the resulting layout.
In other words, will changing the geometry of any of these elements trigger layout against most or all of the page? If so, which one triggers more? You can use the sample site to find out.
Clicking once makes a change to the body, clicking again makes a change the top level div, and the last click changes the child div.
If you’re already familiar with DevTools, you can record a timeline trace to see what layout happened after each click on this page. If not that’s no big deal,you’ll be learning how to use the timeline next lesson, and i’ll be demonstrating how to find information about layout in the solution video.
You can also check out the link in the instructor notes fora little bit more information. So, do some analysis if you can, but otherwise make a prediction. Will changing the width of the body trigger layout with a larger scope than changing the width of this div, or will they have the same scope? Pick one of these answers.
Links
- Sample Site
- How to Use the Timeline Tool - The Timeline tool is now deprecated’. See Performance Tool below.
- Get Started With Analyzing Runtime Performance - Replaces Timeline Tool
9.10 Solution
Which change creates more work for the browser during layout?
- Changing the width of the body
- Changing the width of the div
- They create the same work
Right! No matter what, layout needs to be run against the whole page.
Believe it or not the correct answer is that they have the same scope. In both cases the browser has to assume the worst. Meaning that the change invalidated the entire DOM.
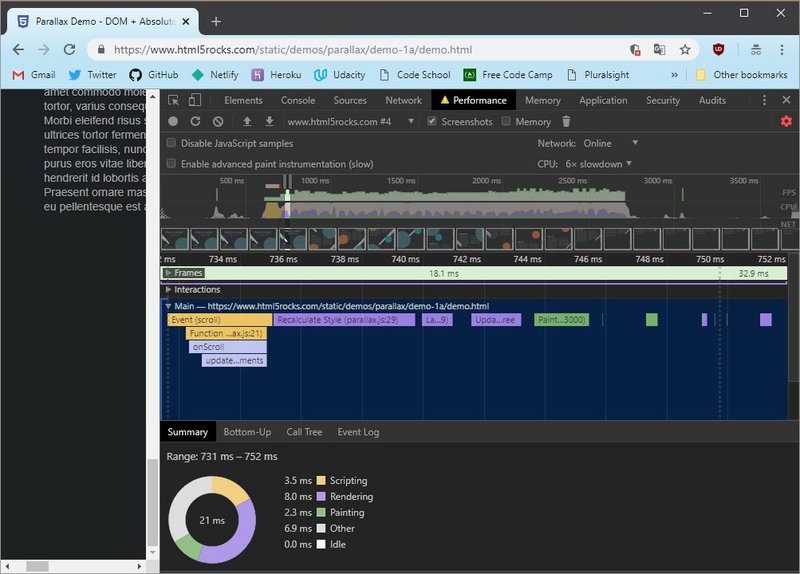
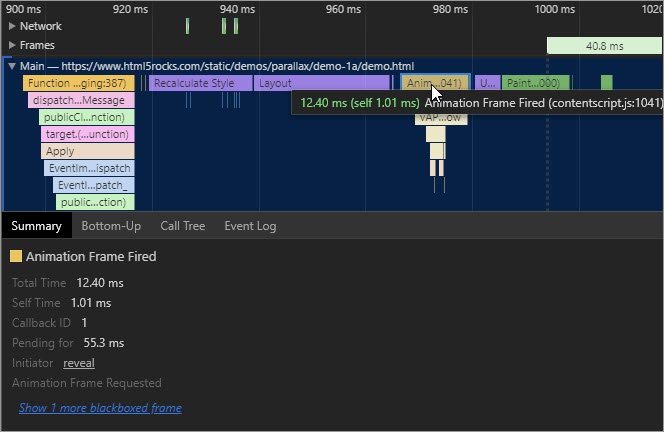
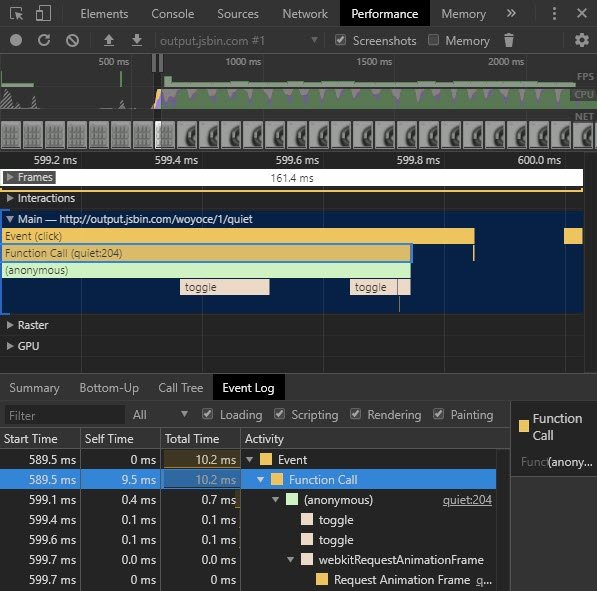
The browser then has to keep the entire DOM in scope while it’s running layout. This is the Performance panel in dev tools which you’ll be spending quite a bit of time with later in this course.
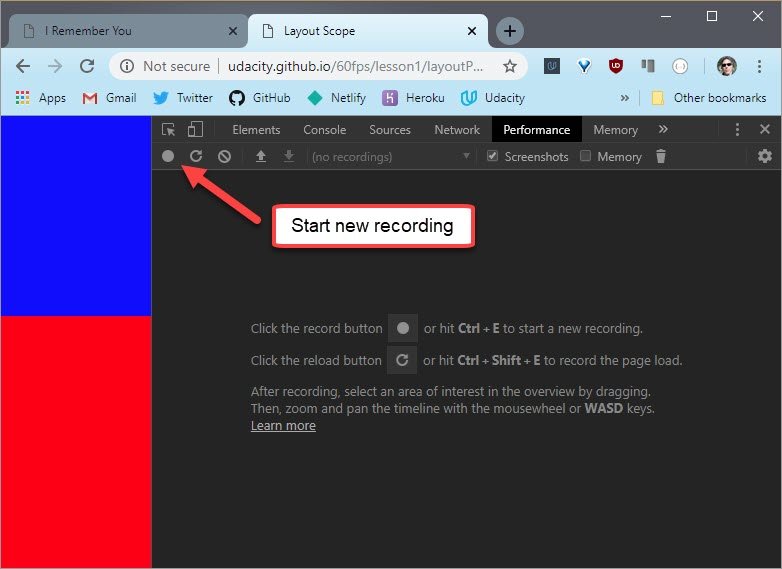
To see what happens when I click around on the page, I will go ahead and click this button which starts recording and then I will click once, twice, three times and then stop recording.
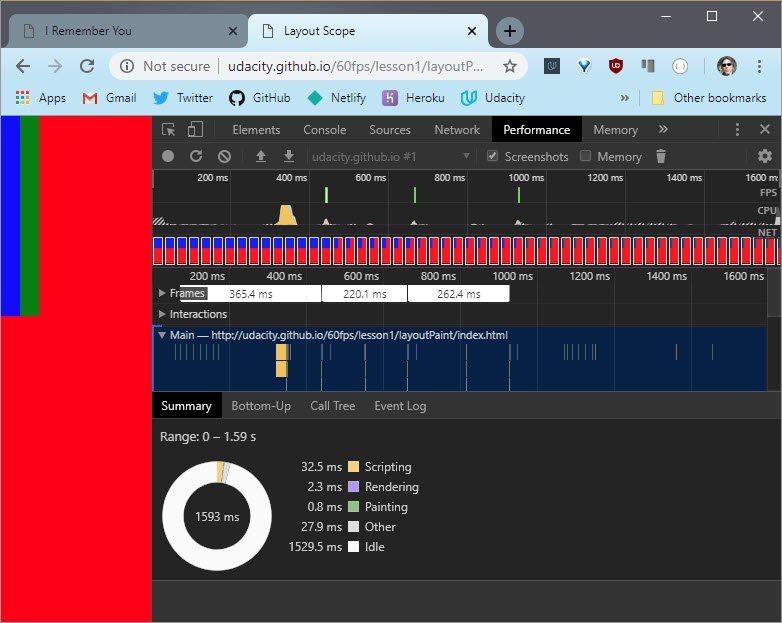
Like I said, you’ll be spending quite a bit of time with this tool later in the course, so I’m going to quickly zoom in and show you what you need to see.
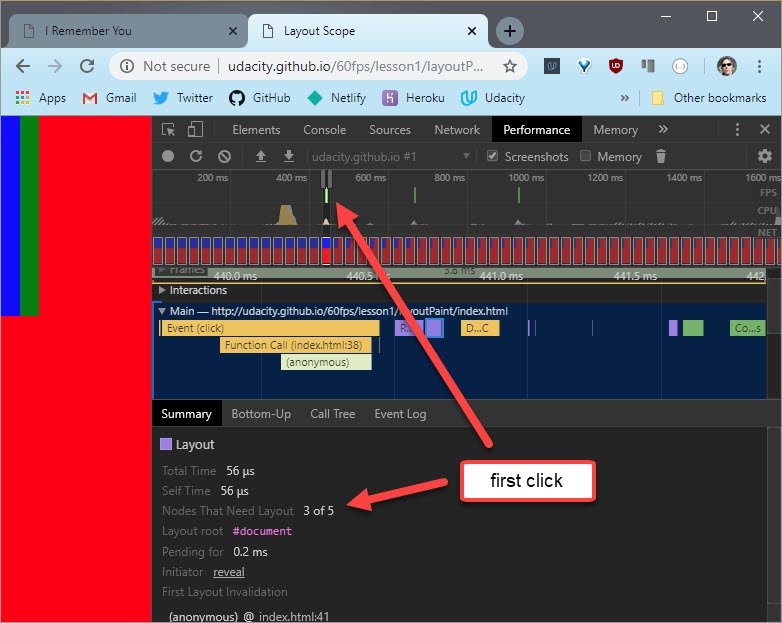
This is the first click event which affected the geometry of the body.
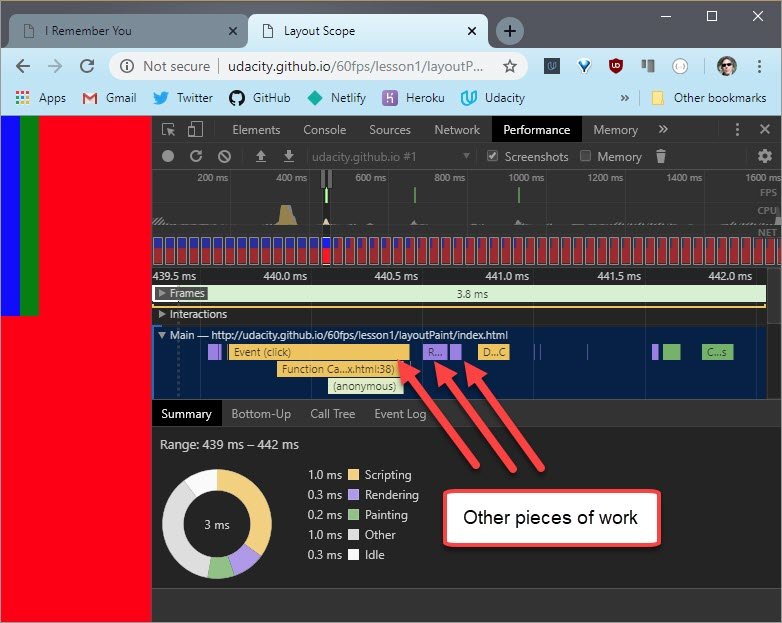
You can see that the click lead to other pieces of work.
Next I click on the Layout segment which gives me further detail.
I can see that “Nodes That Need Layout” is 3 of 5. Which means that three of the five DOM nodes are affected by this.
Okay now I wonder what it looks like for the other two elements.
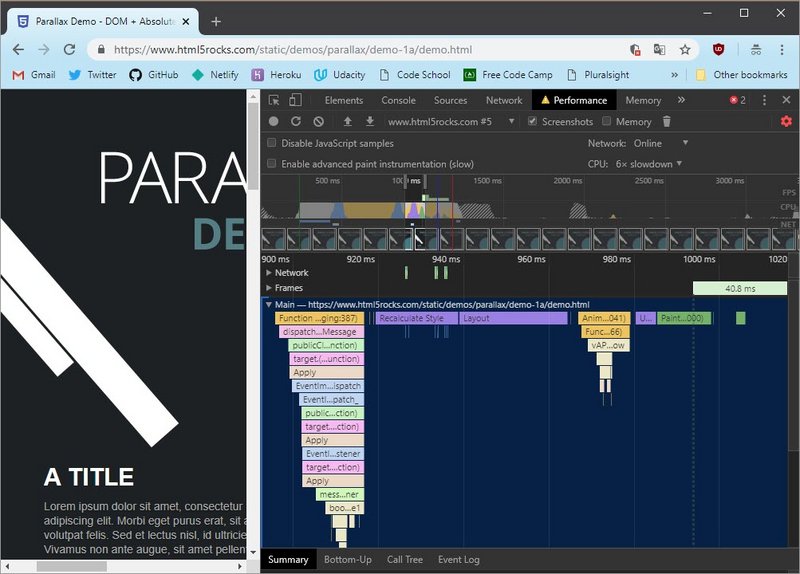
Here’s the second click event, which affected the top level div. And this is the resulting layout.
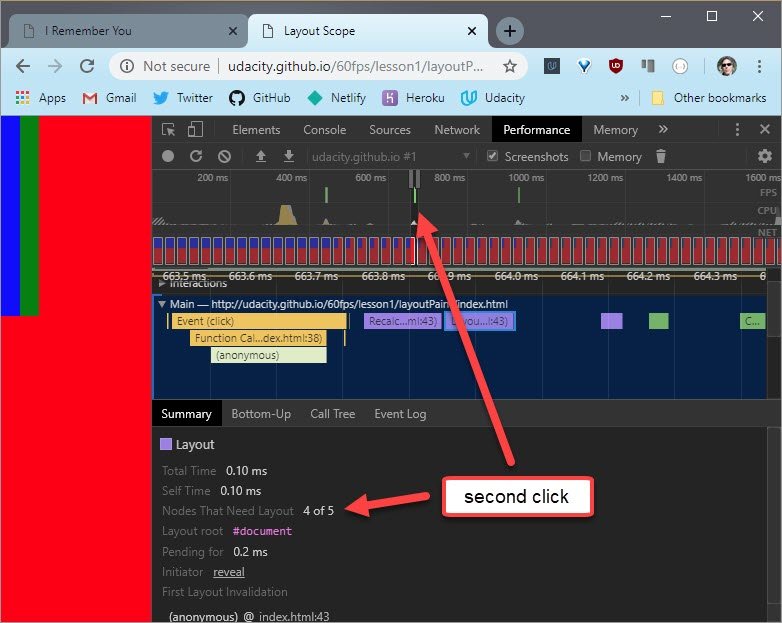
Notice that, in this case, that four of the five nodes were affected by this.
Now I’ll look at the last one. Here’s the last click event on the child div. So this div is the farthest down on the DOM. And here’s the resulting layout.

Here it looks like all five nodes are affected by this.
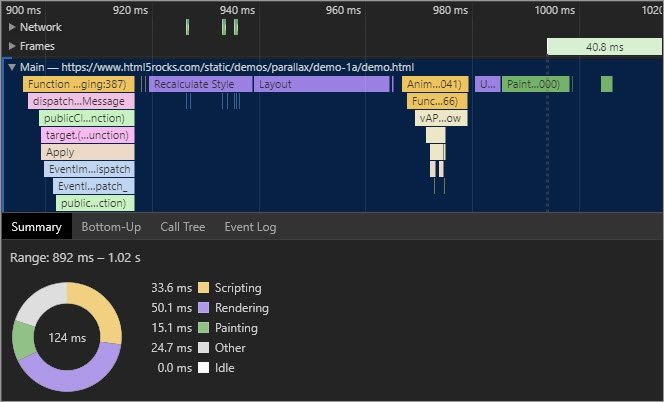
You may have noticed as I was going through the clicks that the different layout events affected different numbers of nodes. But the whole time the entire DOM was in scope.
In case you’re wondering, it’s possible but very difficult to limit layout scope. You can use something called a layout boundary but Paul and I won’t be getting into that in this class.
So if there is one take away from this question, it’s that the layout process is complicated and it’s probably best to assume that the entire DOM is always in scope.
9.11 Layout and Paint
So this is what a typical frame looks like for as developers when things are more than just a static page.

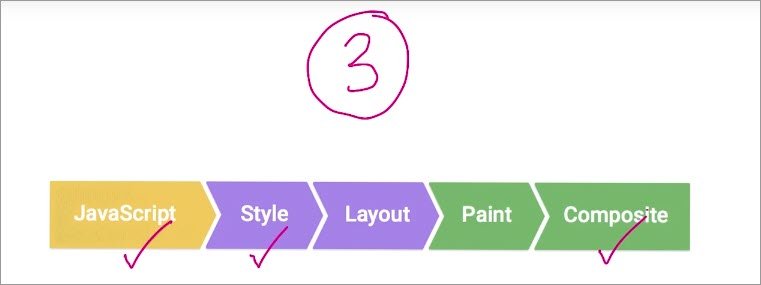
It looks like the pipeline I talked about just before except I’ve now chucked JavaScript at the front.
Normally, you’re going to use JavaScript to handle work that will result in visual changes. Whether it’s jQuery’s animate function, sorting a data set, or adding DOM elements to the page. But you don’t have to use JavaScript for your visual changes. In fact, for many applications developers use CSS animations, transitions, or even the new Web Animations API to make visual changes to their page.

Now with that out of the way, we can talk about the pipeline a bit more.
The changes we make here won’t necessarily trigger every part of the pipeline either. In fact, there are three ways the pipeline normally plays out fora given frame. So let’s talk about those for a second.
One
So number one, you make a visual change either with CSS Or JavaScript.
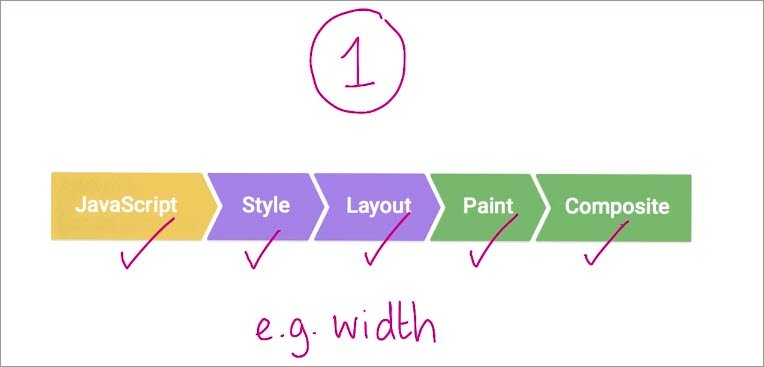
The browser must recalculate the styles of the elements that were affected. Now if you changed a layout property, so that’s one that changed an element’s geometry like its width, height, or position with relation to another element like left or top, then the browser will have to check all the other elements and re-flow the page. Any affected areas will need to be repainted. And the final painted elements will need to be composited back together.
Two
The second way the pipeline gets used is when you change a paint only property, like background-image, text color, or shadows.

This time, we make the change, the styles are calculated, we don’t do layout because we didn’t change the geometry of any elements. We do paint and we do composite.
Three
And the last way involves changing something that requires neither layout, nor paint, just compositing.
Compositing is where the browser puts the individual layers of the page together. And that requires layer management to ensure we have the right layers, and in the correct order. So we make our change. We do style calculations, but we only do composite.
You probably noticed that style was always included for each of those variations. Different styles affect which parts of the pipeline we touch; And therefore the performance characteristics of our apps.
9.12 Quiz: Render
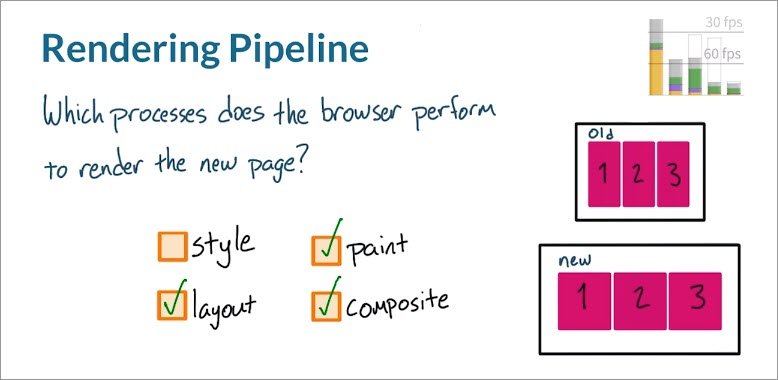
Here’s a scenario for you to consider. Flexbox is a very useful tool for responsive design. It’s a CSS display property that resizes elements, and reflows them on the page. For instance, imagine you’ve got these three elements on a page and then the user resizes the screen to become larger. As a result, the elements themselves become larger.

In this scenario, which of the following processes does the browser perform to render the new page? Does the browser perform style, layout, paint, or composite? Check all that apply.
9.12 Solution
I’ll start with style. There are no style calculations here, because the element styles are already known. So, on the screen resize event, the styles are actually applied through layout. And as you just learned, if the browser runs layout, it also has to paint the elements in their new positions on the page, and then composite them together.
There are actually exceptions to the lack of style here, however. If there was a resize handler that changed the style, or if a media query break point was hit, then the browser would actually have to recalculate styles. But that’s not happening here, so don’t check that box.
9.13 Quiz: CSS Research
For this quiz, I want you to head over to csstriggers.com and do some research.
I want you to find a CSS property that triggers layout, paint, and composite, and type it into the first box. Then find a CSS property that only triggers paint and composite and type it into the second box. Lastly, find a CSS property that only triggers composite and type it into the third box.
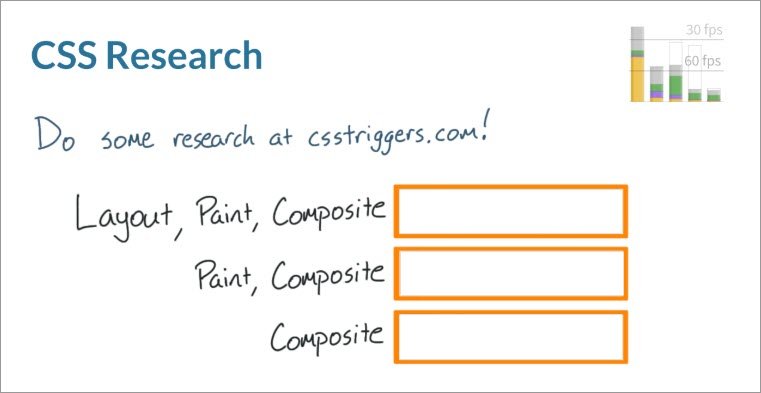
The reason you’re checking out csstriggers.com is because it’s a super useful resource for determining the amount of work your CSS will trigger.
It’s really important to become familiar with it if you want to write performant websites.
9.13 Solution
This quiz, I picked margin-left for layout, paint, and composite, color for paint and composite, and then transform for just composite.
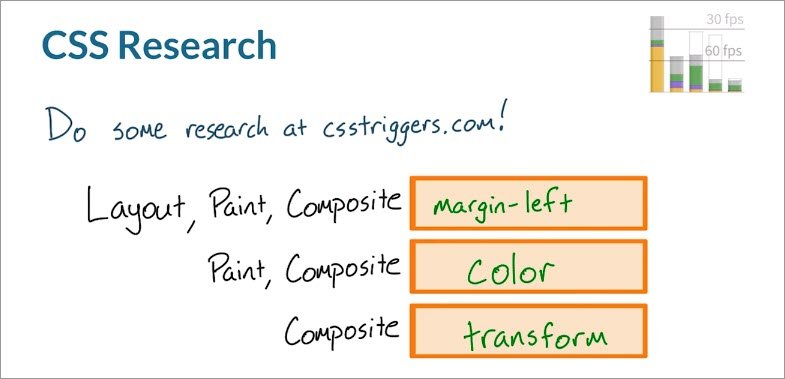
Not all CSS is created equal. Some CSS properties have much wider-reaching consequences than others.
Your CSS should trigger the least amount of work possible, and that’s going to mean avoiding paint and layout whenever possible.\
Transforms and opacity are far and away the best properties to change, because they can be handled just by the compositor if the element has its own layer. You’ll learn more about how to create and manage layers later in the course.
9.14 Final Project
Right now you are looking at the app that you’ll be debugging at the end of this course.
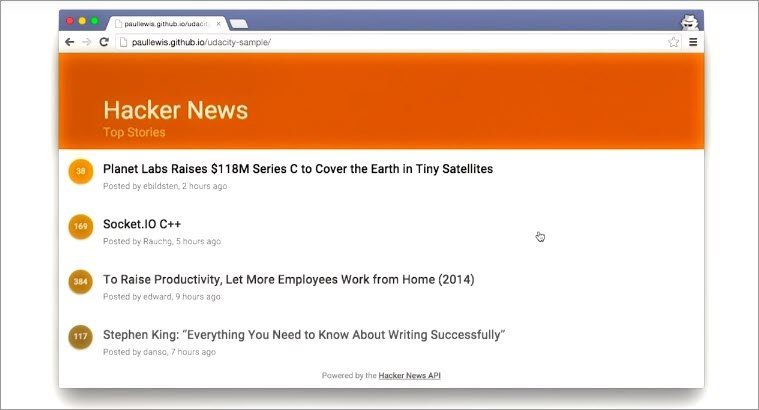
It uses the Hacker News API to show the most recent stories and their scores.
Right now its performance is pretty awful, especially on mobile, but there’s really no reason it shouldn’t be hitting 60 frames per second.
By the end of this course, you’ll have the skills, techniques, and above all, you’ll have the mindset needed to turn this janky experience into an amazing 60 frames per second experience.
9.15 Lesson Outro
Okay, you’re well on your way to getting some good performance. You know
- why we care about hitting 60 frames a second
- what goes into making a frame
- that the properties we change affect the performance in different ways
In the next lesson, you’ll begin your first real performance battle. Jank is more problematic at some points in an app’s life cycle than at others .And you’ll need to spend your time and effort on the areas that matter most to your users.
10. App Lifecycles
10.1 Lesson Intro
In the first lesson, you learned how the browser renders pixels from HTML, CSS,and JavaScript. Understanding this process is key to optimizing an app’s performance.
In this lesson, you’ll take a step back to think at a high level about your app’s life cycle as a whole. The goal is to help you make intelligent choices about when your app can and should do the heavy work to create a buttery smooth experience for your users.
Now, before we start, I have a question for you. Should your goal be to make your app run at 60 frames per second all of the time? The answer is no, actually, not quite.
It’s important that you pick your battles a bit, and focus on the things that matter to your end users. When you think about it, there are actually four major areas of any web app’s life cycle, and performance fits into them in very different ways.
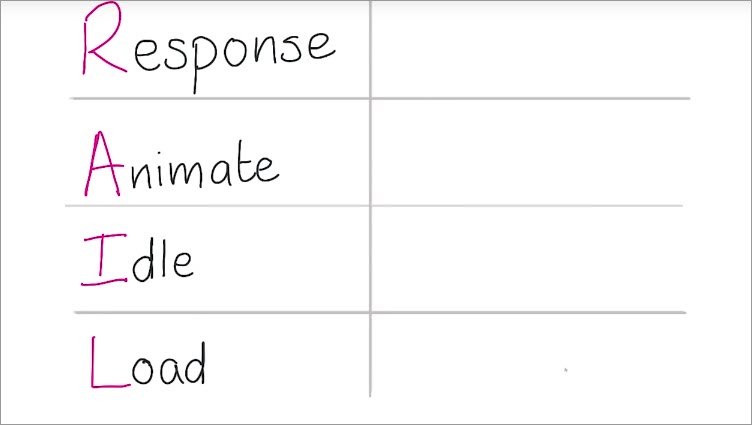
10.2 RAIL
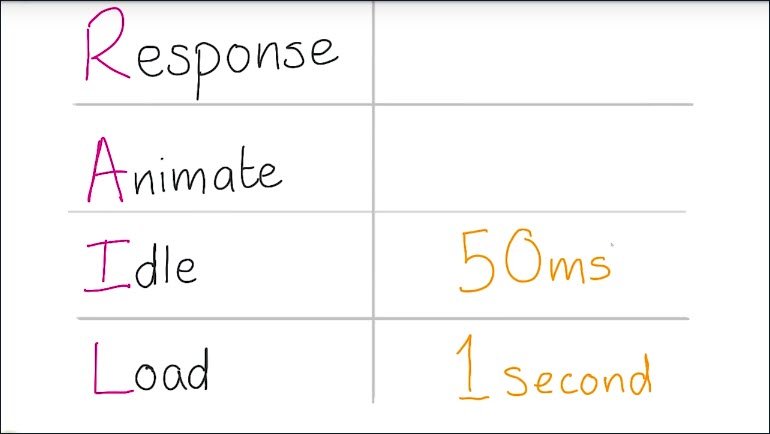
I call the four major areas of a web up’s life cycle RAIL. RAIL stands for
- Response
- Animations
- Idle
- Load
Wait. That’s not chronological order. Shouldn’t it be LIAR?
- Load
- Idle
- Animation
- Response
It turns out LIAR is a less popular acronym than RAIL? It’s just a good way to remember it, and yeah, even though, you do loads at the start, most apps do multiple loads with XHRs and web sockets and HTML imports.
Anyway, orders of letters, not withstanding, it’s really a useful way to conceptualize and group your apps workload.
Let’s do them in chronological order though.
10.3 Load and Idle
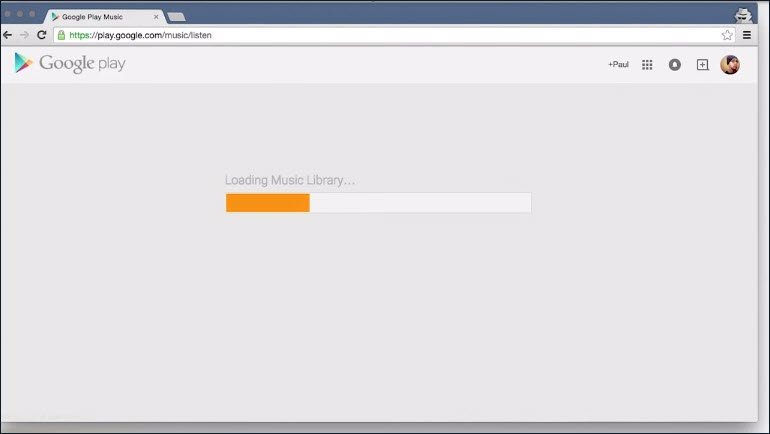
So the first we’re going to look at is Load. Whatever it is, users want it to load quickly, and it’s super important that we optimize for the critical rendering path.
Earlier I took you through a quick tour of the rendering process in the first lesson,but essentially you want your initial load to be done in one second.
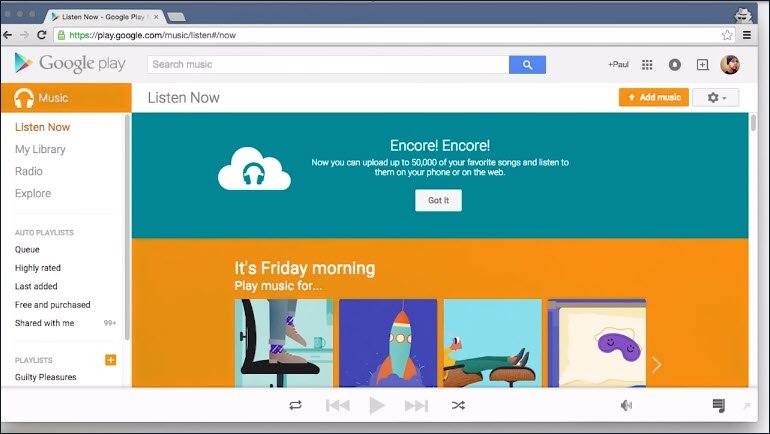
Okay, I’m going to switch across to Chrome, and I’m going to load Google Play Music, and I suspect it’ll load in about one second.
Now after an app’s loaded, it’s normally idle, it’s waiting for a user to interact. And this is our opportunity to deal with things that we deferred to meet that one second load time.
Normally, these idle blocks are around 50 milliseconds long, although you may several of them in one go.
These idle blocks are fantastic times to get some heavy lifting done so that when the user interacts things are nice and snappy. I’ll stop for a second and let you think through the best way to approach an app’s idle time.
10.4 Quiz: Idle Time
In this quiz, you’ll be thinking about this hypothetical news app.
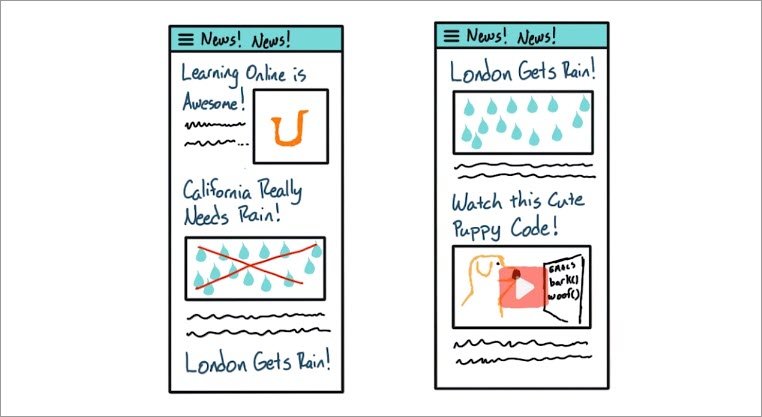
Inside the app, users will be reading articles about how California’s in a drought. They’ll be looking at images like this in London, where they actually do get rain. And they’ll be watching videos like this, where a Golden Retriever is writing some JavaScript because that’s definitely something that could happen.
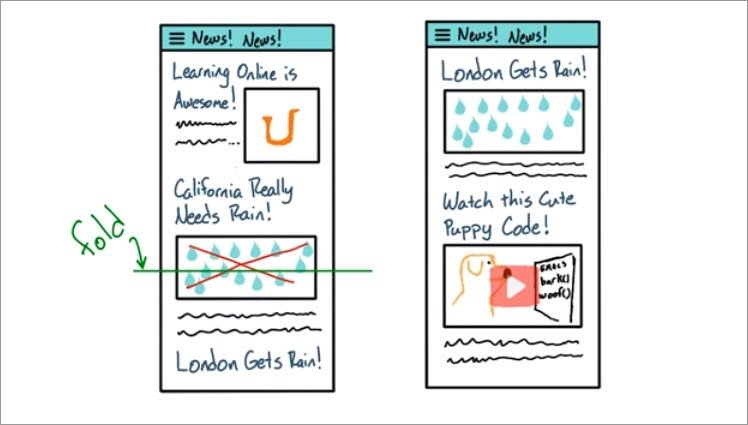
You’ve booched up the app to render content above the fold pretty quickly. You also know from your analytics that most people look at a page for a couple of seconds, before they start interacting.
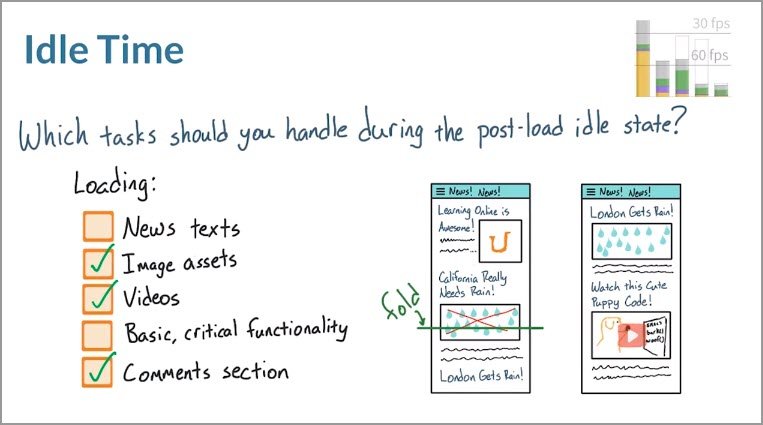
So, with that in mind, what kind of tasks should you handle during this post-load idle state?

Should you load the text for news stories? Should you load image assets? Should you load videos like the web deb Golden Retriever? Should you load the app’s basic critical functionality? Or should you load the comments section?
10.4 Solution
The correct answer is everything except for the news text and the basic critical functionality.
In order for the app to even work, you’ve got to deliver the basic critical functionality. So this shouldn’t be coming after the load.
Also, people would be visiting a site like this specifically to read the news text, so they should be there as soon as the first pixels are being painted.
Everything else though, like images, videos and the comments section can come later. In fact, this is probably a pattern you’ve seen before on other apps.
Keep in mind, however, that user actions could actually still happen during the post load idle state. And in a moment you’ll learn that you only have one hundred milliseconds to respond to those actions.
This makes it all the more important to keep the post load task that you’re performing to fifty millisecond chunks.
10.5 RAIL Response
You’ve handled Load and considered what you might do during periods of idle time.But what next?
Well, the user’s going to interact with the app, and you need to be responsive to that. This isn’t responsive in the sense that it responds to screens of different sizes. This is responsive in the sense that it reacts to the user input without delay.
Well how responsive does it need to be then? Well, studies show that there is a limit of 100 milliseconds. So a tenth of a second after someone presses something on screen before they notice any lag.
So if you can respond to all user input in that time, you’re good to go.
That’s great if the thing they did was to say, toggle a check box or tap a button. And you show a single change, like a selected state. But there’s another version of this which is more challenging, which is that the user does something that requires animation.
The most challenging performance issues always come out of the need to hit 60 frames a second. Which is either interactions that stick to the user’s finger or transitions and animations.
For those we have a limit of 16 milliseconds. Which is one second or a thousand milliseconds divided by 60.
In reality, we actually have less than 16 milliseconds, because the browser has overhead. So really we get around 10 to 12 milliseconds. That’s not a lot of time.
10.6 RAIL Animations 1
So some user interactions need 60 frames a second, but so do transitions and animations, like card expansions or menu sliding in. Those need to be at 60 frames a second, too, which isn’t always simple.
It’s so easy to accidentally trigger performance issues, unless you’re very careful about which properties you animate and when.
There are many ways to tackle animations, and it completely depends on your project. I’ll give you an example of one approach I’ve used. It feels like I’m kind of getting into “weird trick” territory here, but seriously this one actually works.
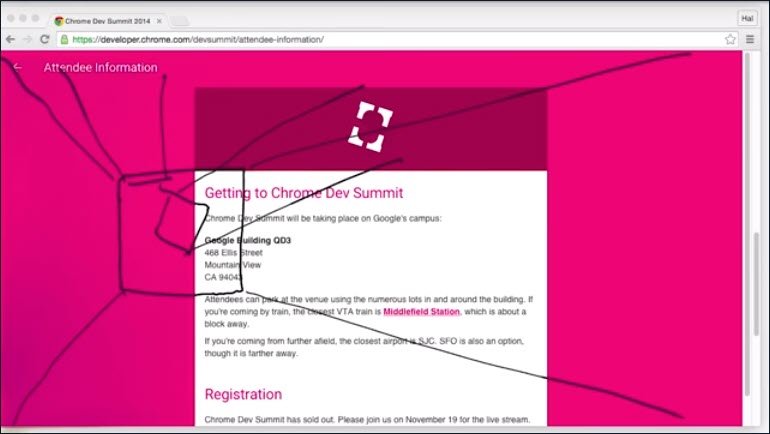
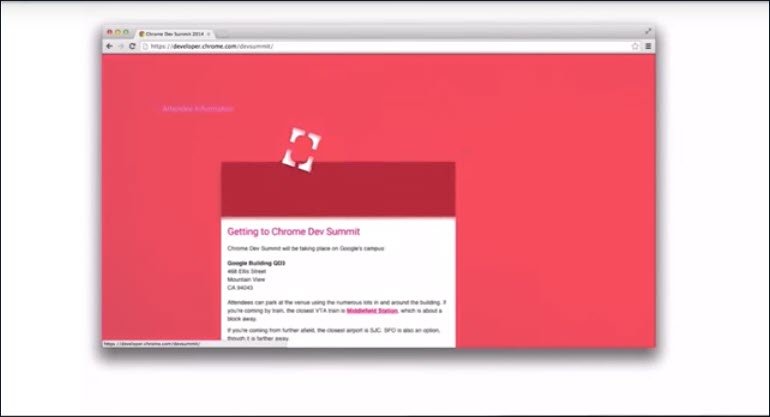
For the 2014 Chrome Dev Summit web sites, I wanted to animate these cards.
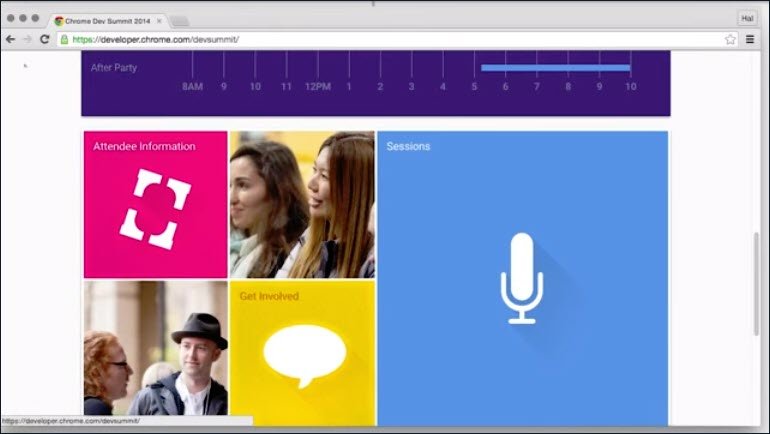
I couldn’t expand the cards fast enough to maintain 60 frames a second, so I had to try something a bit different. I tried working backwards.
I call my strategy FLIP. First, Last, Invert, Play.

I took advantage of the fact that once the browser had done the initial hard work to run the animation once, I could run it backwards at very little cost. It’s like pre-calculating the expensive work.
My code took the start point of a card,and then it took the end point when the card was expanded.
So let’s say the card was about here when it started, and the icon was like this.
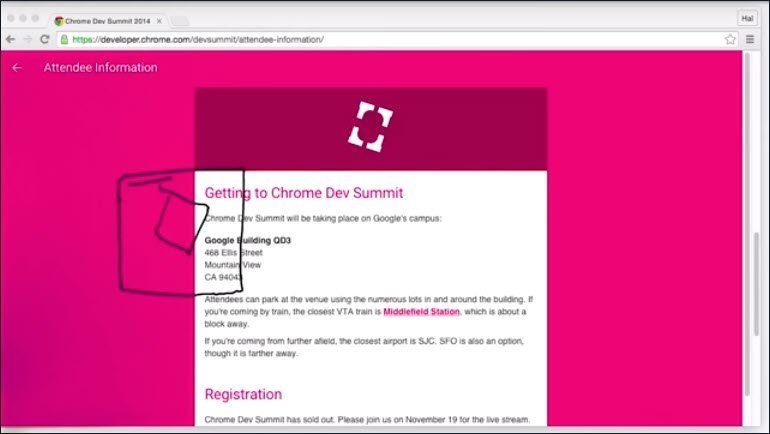
Using getBound and ClientRect, I measured all the elements’ positions before and after.
That then meant I knew how far everything needed to move on the page, and if it’s opacity changed, I also knew that as well.
So back here again. First - is where the card starts. Last - is where the card finished. Now we need to talk about inverting.
I use the information from first and last to apply transform and opacity changes to reverse the animation.
With a little bit of extra work with clipping, it was like the card had never moved.
So, now we’ve inverted the animation. We can just simply play it and it runs smoothly.
10.7 RAIL Animations 2
And this is what it looks like in code.
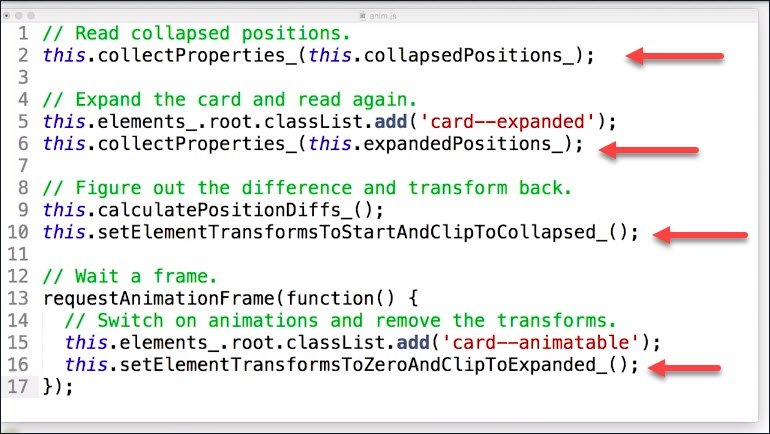
- Firstly, we collect the properties of the card in a collapsed position.
- We expand the card and collect the properties again.
- Next, we figure out the differences and then we transform the card back.
- Because we made this style change we have to wait a frame for those style changes to take effect. Otherwise, if we change them again the browser would ignore these and we’d see no animation.
- Now we’ve waited a frame.We can switch on animations and remove the invert, transforms, and our past two changes.
All that property collection, probably sounds quite expensive and you may be wondering how you can afford to do it. It sounds like a lot, and it is. I mean, you’re doing all these calculations on demand whenever a user clicks or taps on a card.
Well it turns out, I was making use of the 100 millisecond response window to do all those experts of calculations up front.
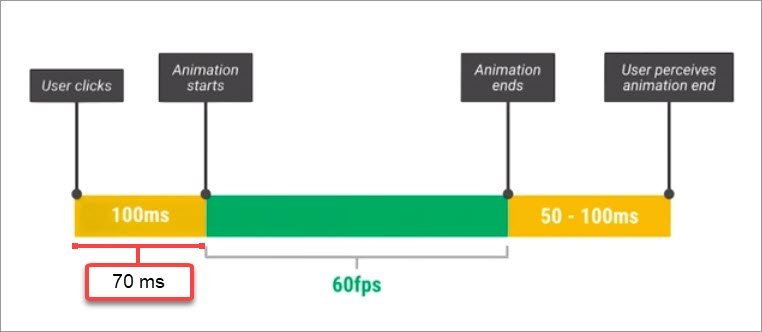
On a Nexus 5 it took around 70 milliseconds to get everything done, which is well inside that 100 millisecond boundary.
10.8 Quiz: Rendering Animations
Paul just explained how he used FLIP to create a pretty snazzy animation. He performed all the hard calculations up front, so that he would touch as little of the pipeline as possible during the actual animation.
This is how he kept it going at a silky smooth 60 frames per second. When he applied opacity and transform changes to reverse the animation, what steps in the rendering pipeline did Paul trigger?
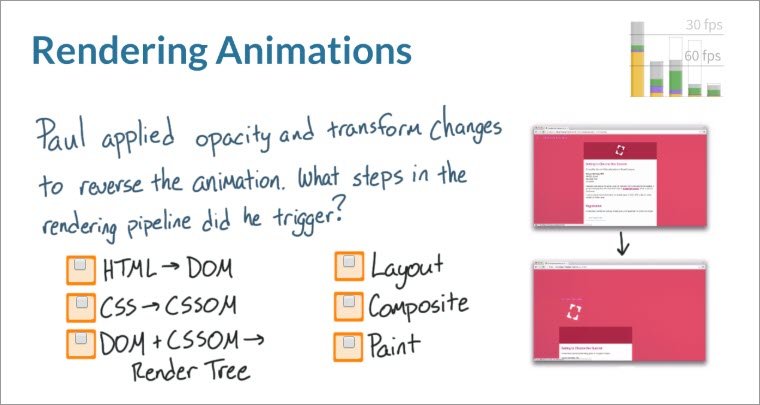
Did the HTML need to get converted to the DOM? Did the CSS need to get converted to the CSSOM? Did the DOM and CSSOM need to be combined into the Render Tree? Did the browser have to run Layout again, Composite again, or Paint again? Check all that apply.
10.8 Solution
Great job! Notice how opacity and transform only trigger composite? Keep that in mind as you build your performant apps.

As you just discovered, changes to opacity and transform only trigger composite when the elements are on their own layers. But remember, Paul also had to use clip to reverse the animation. And that, unfortunately, requires paint.
It’s important to always understand the implications of any property you choose to animate, because some are definitely cheaper than others.
10.9 Quiz: Interactions & Animations
During the response section of rails. You saw that you have about 100 milliseconds to respond to user input. But, some user interactions also require animations which then need to run at 60 frames per second.
What kind of interactions do you think require 60 frames per second animations?
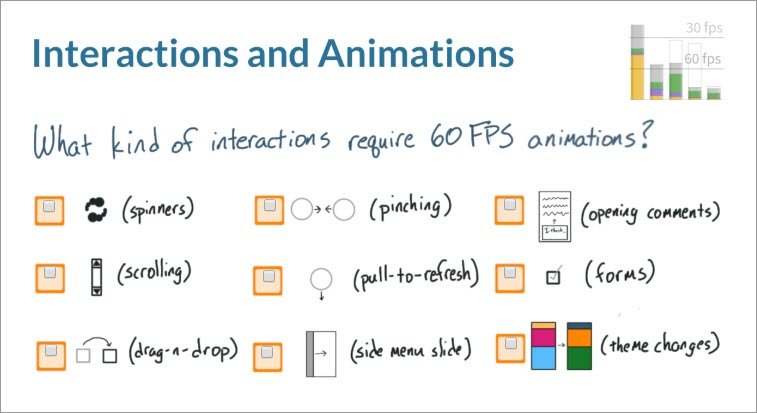
Should spinners always be running at 60 frames per second ?What about scrolling? Dragging and dropping, Pinching, Pulling to refresh, Menus sliding out from the side, Comment section opening from below, Changing the state of items and forms, Or last but not least, changing the themes of an app? Check all that apply.
10.9 Solution
As it turns out, anything that involves movement or finger on screen interactions will need to run at 60 frames per second.
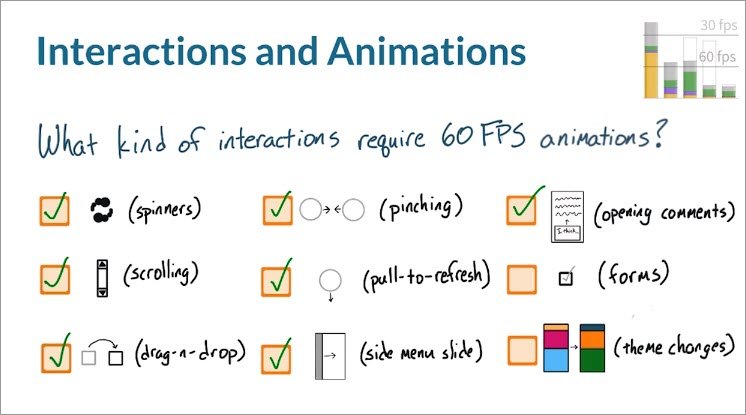
The only two items that don’t fall into those categories are toggling form controls and app theme changes. For these two, you still have 100 milliseconds to respond, but afterwards, the app must continue running at 60 frames per second if it’s going to keep feeling responsive.
10.10 RAIL Review
LIAR stands for
- Load
- Idle
- Animations
- Responsiveness.
Load
During the Load stage you have about one second or a thousand milliseconds to render the page before the app no longer feels responsive, and the user’s attention level falls.
Download and render your critical resources here.
Idle
After loading, the app is Idle, and this is a great time to do non-essential work to ensure that whatever interactions occur after this period will feel instantaneous.
Your app’s idle time should be broken down into 50 millisecond chunks so that you can stop when the user starts interacting.
Animation
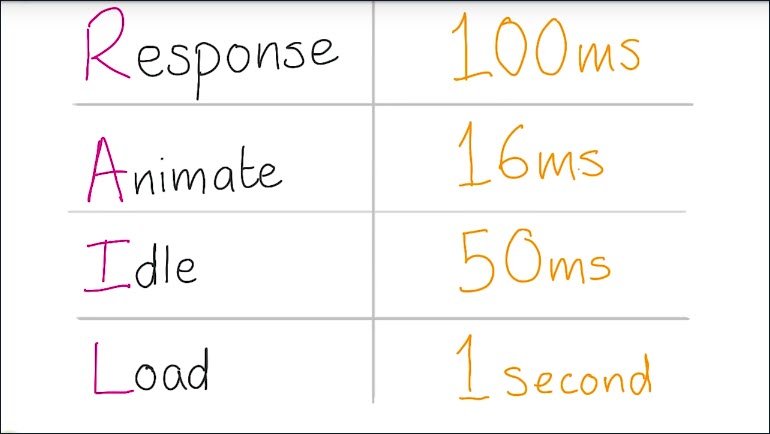
During the Animation stage, such as when users are scrolling or animations are occurring, you only have 16 milliseconds to render a frame.
This is when 60 frames per second is absolutely critical.
Response
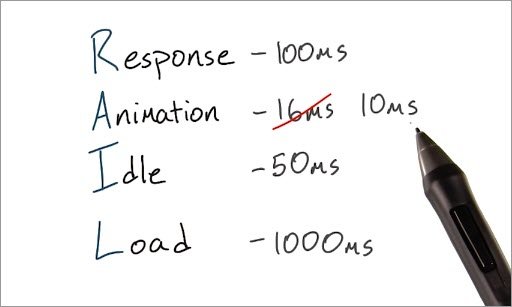
Lastly, there’s the Response period. The human mind has about 100 milliseconds’ grace period before an interaction with the site feels laggy and janky.
That means your app needs to respond to user input in some way within a 100 milliseconds.
Using this time wisely is absolutely critical for setting up difficult animations that run at 60 frames a second.
In the next few quizzes, you’ll be asked to apply what you’ve learned about RAIL in some real-world scenarios.
10.11 Quiz: RAIL 1
For this quiz I want you to pretend that you’re developing an app that displays a loading gif like this one while video resources are being buffered.
Do you think it’s a good idea to request this gif just during the animation phase? It’s also worth noting that if you’re requesting the gif during the animation phase you also have to insert it into the page during the animation phase.
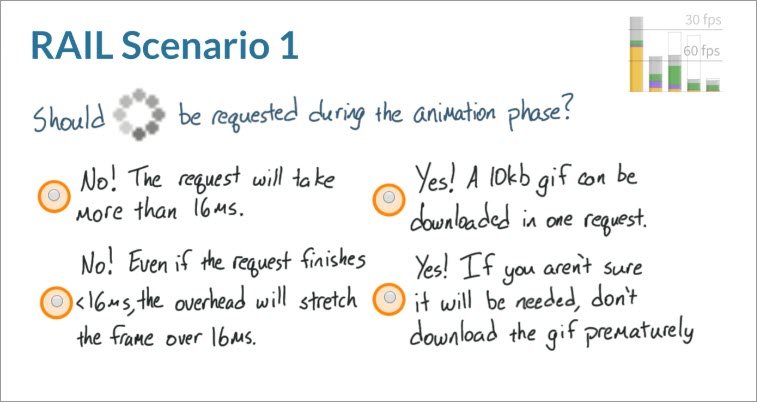
10.11 Solution
The correct answer is either one of these.
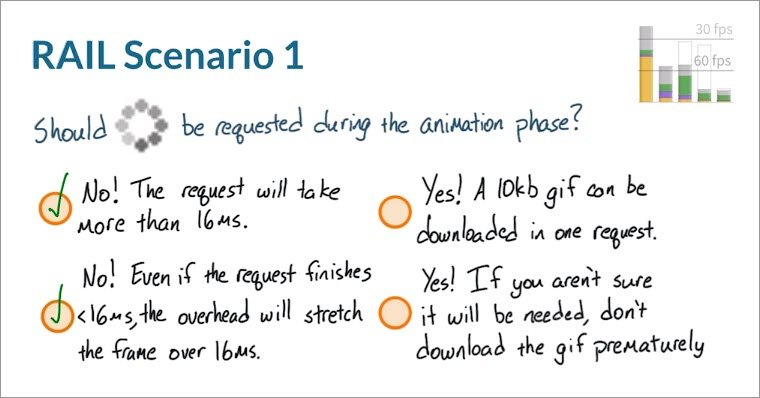
Realistically, there is no way that GIF is going to show up in less than 16 milliseconds and the request adds extra overhead, too, in the animation phase, which is not the time to handle it.
Have the GIF prepared well in advance before the users actually click on video. It’s small, so why not make it a part of the initial app load? Either way, don’t request it now.
10.12 Quiz: RAIL 2
I want you to think through the Idle stage. This user has just loaded an app with baseball scores on it. Right now they’re in the 50 millisecond idle period before they start to interact with the app.
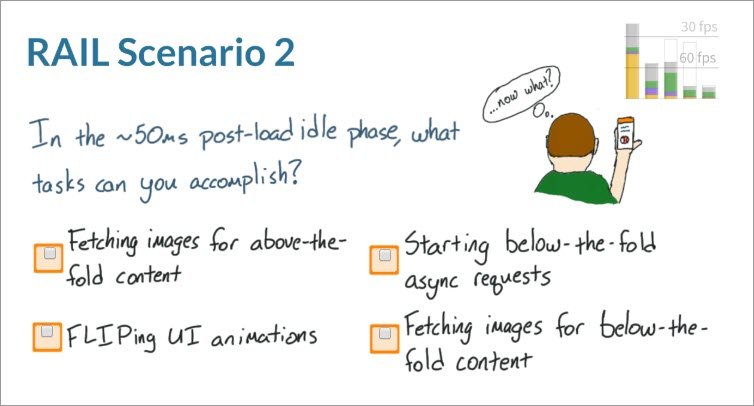
Which of the following tasks can you accomplish in this 50 millisecond period? Check all that apply.
10.13 Solution
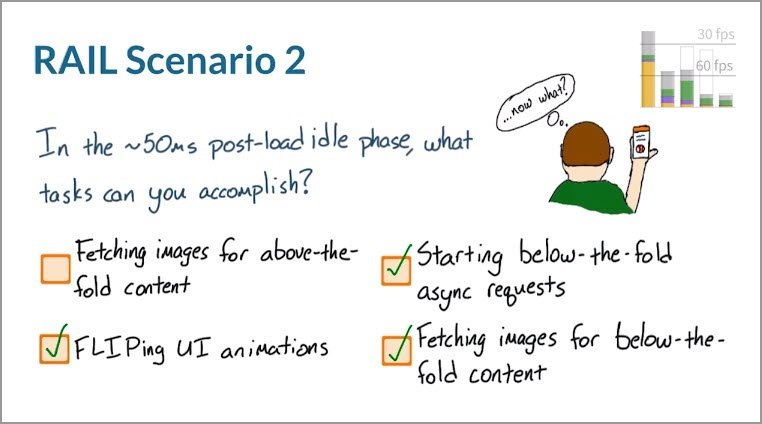
The correct answer here is that you can pretty much do whatever you want so long as it’s not for above-the-fold content, which in all reality, the user should already have downloaded.
10.13 Lesson Outro
So at this point, you know what you can afford to do and when you can do it, which is pretty handy.
Now one thing to bear in mind is just because you can, say, paint or do layouts or even run JavaScript doesn’t mean you have an unlimited budget. Layouts and style calculation times for example, both depend on the number of elements that are affected.
As you’ll see soon, one of the ways you can keep that time down is to reduce the number of elements on which they have to work.
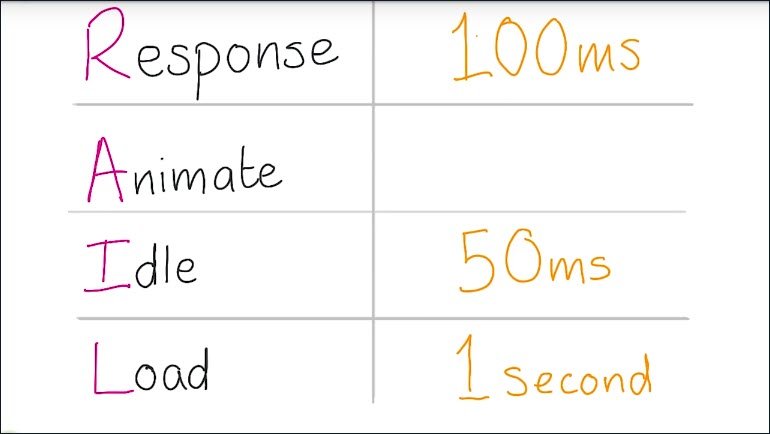
This table shows time allowances for different tasks. It’ll help you set a budget for each of those tasks.
So that you and any other developers you’re working with are all on the same page. It’s time to drill into the specifics of resolving performance issues

In the next lesson you’ll be taking a look at the tools that you have at your disposal for identifying jank in your apps.
The first step in reducing jank is identifying its cause which is exactly what you’ll do.
11. Debug Tools
11.1 Intro
At this point, you know that performance is important, and you know what the parts of the pipeline are. So, now it’s time to learn how to use the tools at your disposal to identify and destroy jank
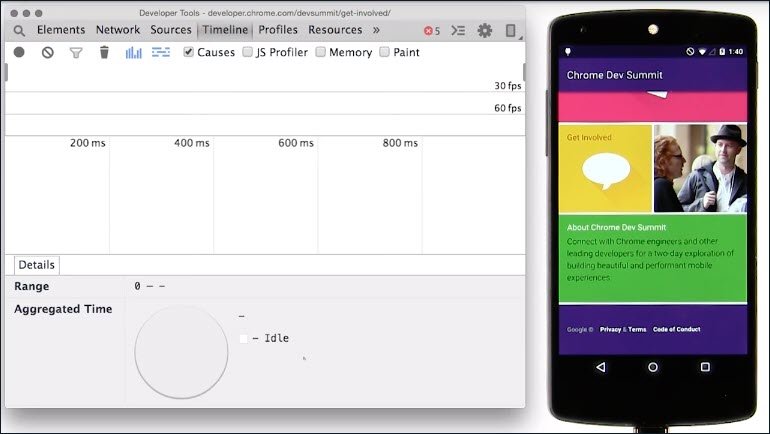
The main tool you’re going to use is Chrome’s DevTools, and in particular, the Performance panel. In this lesson you’ll dive into DevTools’ Performance view to start to identify exactly where jank is happening.
11.2 DevTools
You can open up the developer tools by hitting Cmd+Alt+J on a Mac or Ctrl+Alt+J on PC.
Now that we’re in DevTools, we need to go to the Performance panel. Performance is here to allow you to track frames per second (fps) for your project. You can record a timeline and it will tell you what fps you were getting and for each frame, what work was involved. That work will tie back into the pipeline you learned in the last lesson.
Now I’m going to hit record and then I’m going to scroll around the site. Now I can stop the recording and I get a load of records back. At first glance I think the user interface can be a little bit overwhelming, so let’s just look at it bit by bit.

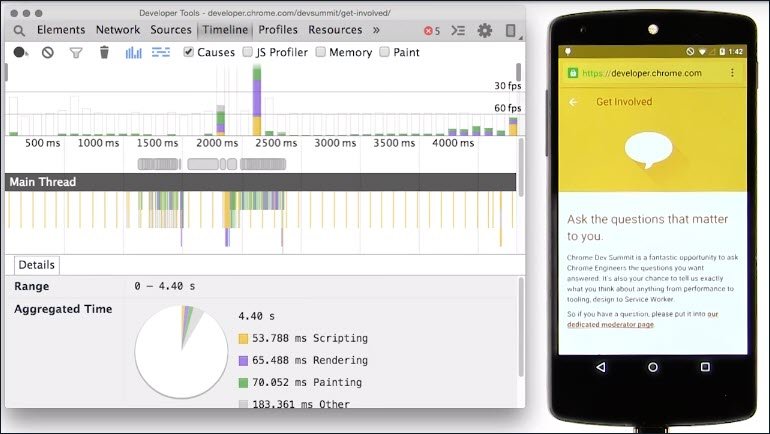
The green bars at the top indicate the frames per second. If we’re trying to hit 60 frames a second, all these bars should be tall. The lower the bar the less frames per second. If we hover over any of the bars in the Frames row we will actually get the fps for that moment in time
Underneath, in the row labeled Main there’s a load of information about how we spent our time in each of the frames. Right now it’s quite zoomed out so we need to actually dive in a little bit deeper.
To do that we simply click drag in the frames area at the top, and now you see it’s zoomed in a little bit more. You can also use the W, A, S, and D keys on your keyboard if you prefer.
Here in the details you can see the parts of the pipeline we discussed earlier. There’s JavaScript, there’s Style Calculations, Layout, Layer Management, Paint, and Composite.
If you’ve never taken a timeline recording before take a moment to go and take your first recording. Go to any website, it doesn’t matter which, and hit record in the timeline. Then explore the timeline and see what you can find out.
Okay, cool. You’re able to take timeline recordings, and you can quickly see where your hitting jank. But now you need to start digging into the details of those frames, and figure out why frames are running long.
11.2 Links Resources
11.3 Performance in Depth
So I have the DevTools Performance panel open here and I had it record what happened during the load of this page. Let’s take a look at the records in a little more detail.
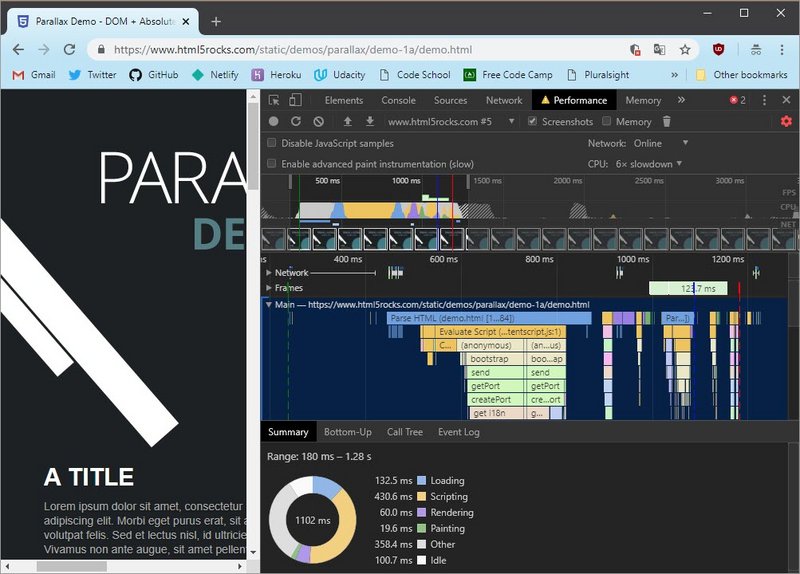
The first thing to notice is that they’re color coded. Blue records are HTML being parsed. Now, normally this is really fast and I haven’t personally seen a performance issue where this was the bottleneck, certainly not past the initial page load anyway.
Moving along a little bit, and zooming in with the W key, just drag that along a little bit, you can see that we actually have two purple records. One is Recalculate Style, and then there’s Layout as well. You can also see I’ve got a green one here which is Paint, and a green one which is Composite.
This is called the flame chart and it represents the main thread activities. The x-axis represents the recording over time. The y-axis represents the call stack. The events on top cause the events below it.
Below that is a series of tabs. The Summary tab and three additional tabular views for analyzing activities. Each view gives you a different perspective on the activities:
- Summary
- Bottom Up
- Call Tree
- Event Log
Summary
The Summary tab can show two things.
First, it shows a pie chart of the relative time spent on each activity for the selected time period.
Secondly, when you click an item on the flame chart it will display details about that item.
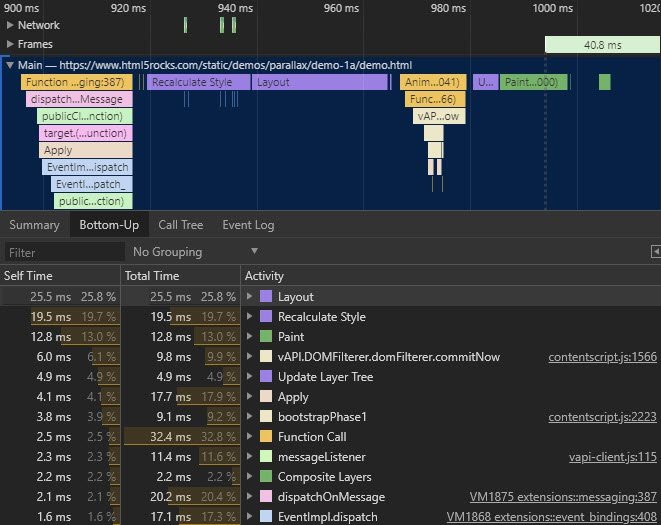
Bottom Up
- Bottom Up - When you want to view the activities where the most time was directly spent, use the Bottom-Up tab.
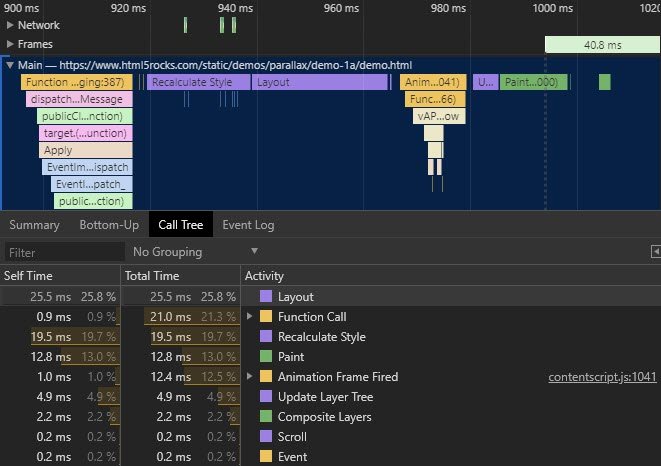
Call Tree
- Call Tree - When you want to view the root activities that cause the most work, use the Call Tree tab.
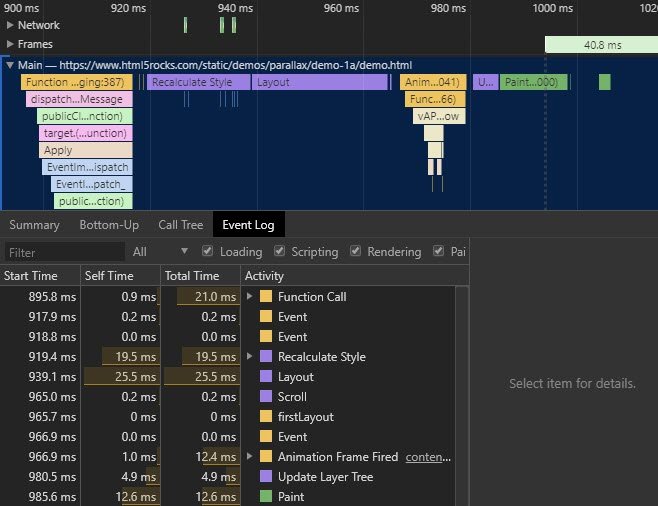
Event Log
- Event Log - When you want to view the activities in the order in which they occurred during the recording, use the Event Log tab.
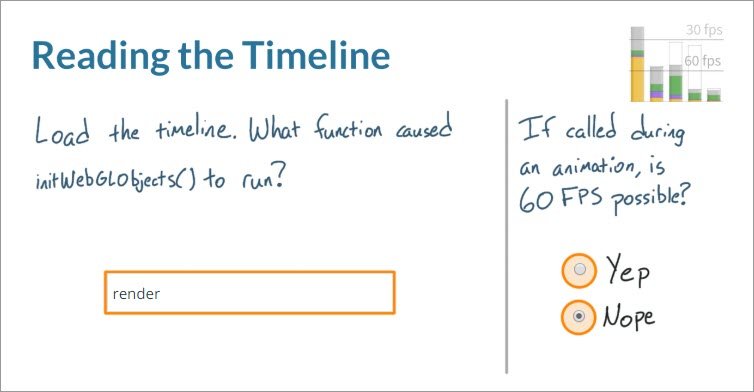
11.4 Quiz: Reading Timeline
For this quiz, I want you to load a timeline. You can do it pretty easily. Simply right-click in the timeline and go to Save As to save one, or Load to load a timeline.
Loading a timeline is a super easy way to share and compare timelines. You can download a timeline here for the exercise.
Once you’ve loaded the timeline, see if you can figure out which function caused initWebGLObjects() to run. Type it into this box. And finally, if this JavaScript was called during an animation,would it still be possible for the animation to reach 60 frames per second? Yes or no.
11.4 Solution
I’ve got the Flame view open, and it’s pretty apparent that some kind of work is being repeated over and over. I’ll just go ahead and zoom into one of these chunks.
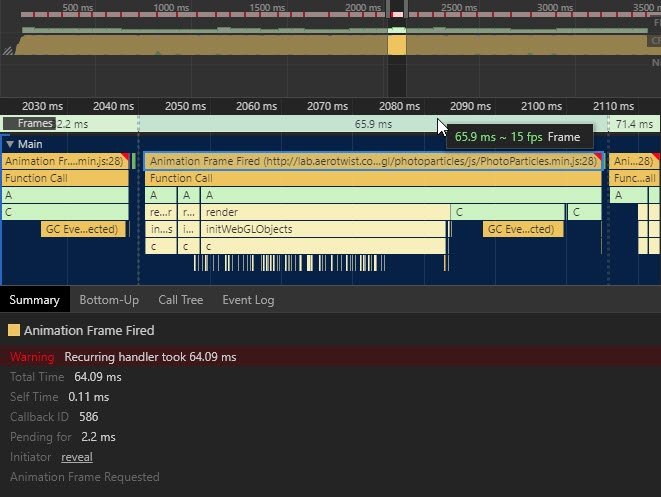
With this closer inspection, it becomes pretty obvious that render is causing InitWebGLObjects to be called.
At the top, you can see that the code ran for about 66 milliseconds, which is well over the 16 millisecond budget per frame. This unfortunately means that there is no way this app is going to run at 60 frames per second.
Looking at the frame viewer at the top, you can see that these frames are made up almost entirely of JavaScript, hence all the yellow bars. This means that this code is definitely going to need some refactoring if it’s going to run at 60 frames per second.
So the correct answers are, render as the function and, no ,it is not going to run at 60 frames per second.
11.5 Identify Jank
Okay, I want to walk you through another example. This is a weight truck app I built a while ago. And I notice that when I open the menu on the left hand side, that it sticks and Janks.
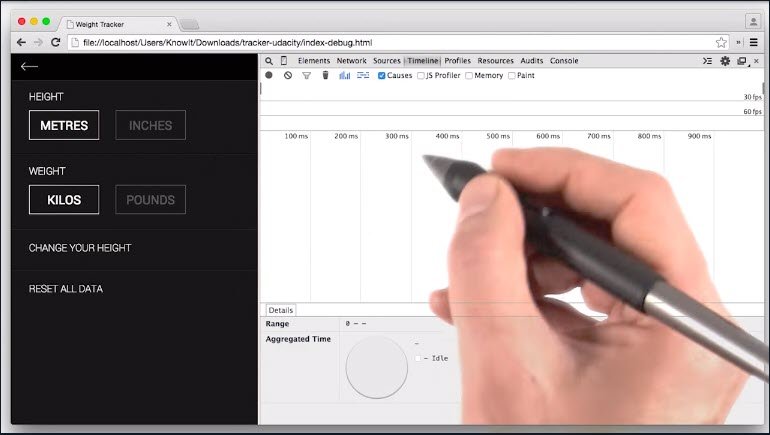
So now with the timeline open, I’m going to see if I can find out what the cause is. The first thing I do is refresh the page, just so that I know I’ve got a fresh start. Next I hit record, bring out the menu, and stop recording.
Immediately, I see that there are three big spikes of yellow here. So, I’m going to select one of those and I realize that I am spending a lot of time in JavaScript. Once you zoomed in, you can also get details of what’s going on in those frames.
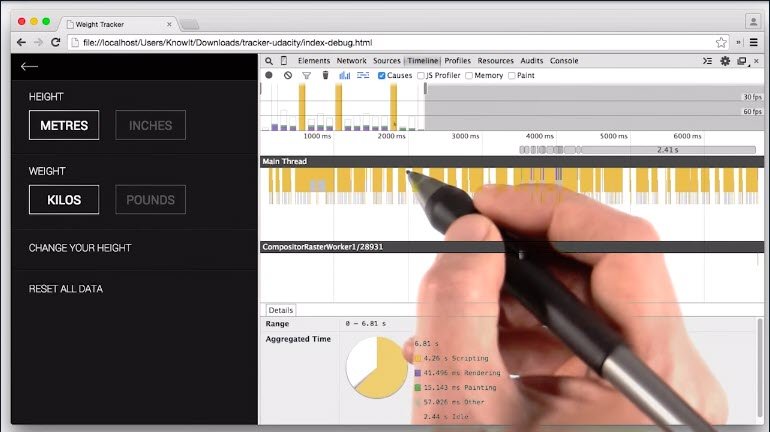
Let me start by dragging this up a little bit more, so we can see it. You can see what it is, how long it’s been working, when it started and a little bit more about how it’s broken down. The time itself and any child records. Lastly, you find out where the task was triggered In your code.
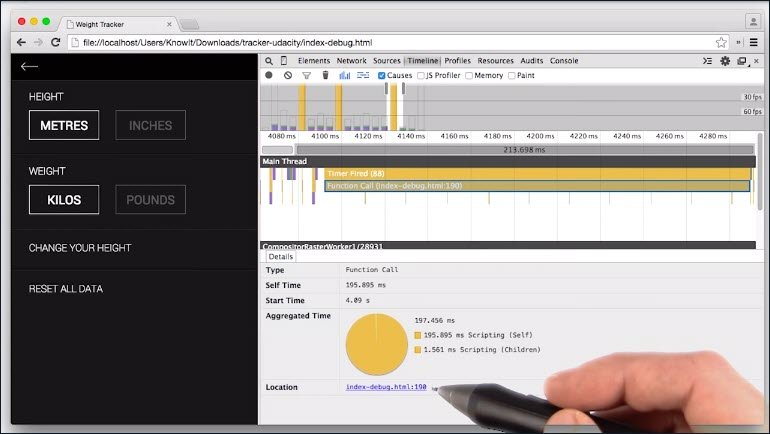
The details will differ depending on the kind of record you’re looking at. For example, Recalculate Style, tells you the number of elements that were affected, as does Layout.
With Layout, we see the tree size, the scope, where it started and in this case, we also see an additional warning. Which we’ll talk about in a little bit. Lastly, we see where in the code we triggered layout.
In this case though, I would be most concerned about these large yellow blocks. They seem to be what’s causing me to stop hitting 60 frames a second.
11.6 Test all Devices
One of the mistakes that people often make is to only test their site’s performance on the desktop.
Because desktops are significantly more powerful than mobiles, it means you can miss performance issues that only show up when on device’s CPU, memory or connectivity constrained.
What you want to do is where you can, test on real devices. If you have an Android device, you can use the same Chrome DevTools you know and love from your desktop. So I can start it, interact, stop,and you can see I got a timeline that I can work with.
If you don’t have an Android device available, you can check out the instructor notes below for how to use the emulation settings in Chrome DevTools. Remember though, that the performance characteristics of simulators and emulators are wildly different to a device itself.
So while it’s good for getting used to the workflow, you’ll need to test on the device itself to make sure that you don’t have any performance issues there.
In the next video, Peter Lovis is going to show you how you can useChrome DevTools with your Android device. If you already know, just skip ahead.
11.7 Setup for Mobile
The set up is simple. All you need is an Android device, a USB cable, and your development machine. Let’s take a look.
Before you get started you need to turn on the Developer Mode in your Android device. This may be different on any given device and you can check your device’s manual on how to do this. In many cases though, you need to go to your device’s settings, click on About Device and then click on Build Number seven times. Seriously.
Next you’ll want to turn on USB debugging. Again, this varies slightly on your given device, but this is usually located in the developer options. We also need to make sure we have the right tools installed. On my laptop, I have Chrome Canary and on my mobile device, I have Chrome Beta installed.
What is Chrome Canary and why should I use it
Chrome Canary is the developer version of Chrome. It looks and acts like the regular Chrome browser, but it includes new and experimental features that haven’t been released yet. We recommend analyzing websites with Canary to take advantage of the latest tech. However, be warned that Canary isn’t guaranteed to be stable, so expect crashes and occasional bugs.
Do I have to test on mobile
For the purposes of this course, no. But testing your websites on mobile is a best practice, and if you have the means to do so we highly recommend it.
11.8 DevTools on Mobile
Now that we have everything set up the way we need, open Chrome on your development machine and go to Chrome inspect. Make sure the site you want to debug is open on your mobile device and then connect your laptop to your mobile device via USB.Then confirm that you want to allow USB debugging.
Back in our development machine, we can see a list of the attached devices and the Chrome tabs that are open on the devices. You can even open other tabs.
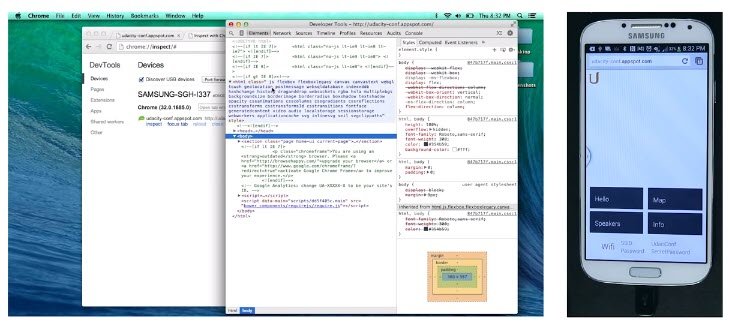
We can also focus on specific tabs, you can reload them and you can even close a tab. The best part of course is that you can inspect the pages that are running on your mobile device, from your development machine.
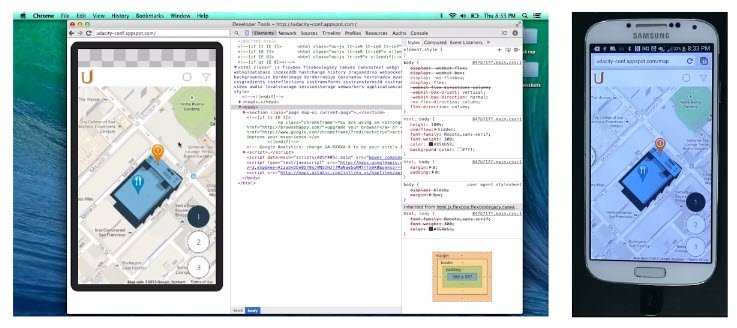
One of my favorite new features is the new screen cast mode. This allows you to drive the experience on your mobile device from your development machine. You can click on links, and see them update simultaneously on the device. As well as on your desktop.
11.9 Mobile for iOS
Now, that was really easy and it’s also possible to do this on mobile Safari with the web inspector using the iOS web kit debug proxy. Now, that’s a little bit harder to set up, so check out the link below for more information.
Please note that in the community, there is a discussion continuing about ios-webkit-debug-proxy. Depending on your version of canary, if you’re using it, it might take a lot of time and some students suggest trying Safari Dev Tools and point to links like this:
https://www.smashingmagazine.com/2014/09/testing-mobile-emulators-simulators-remote-debugging/
Remember you can run in simulator mode in Chrome Dev Tools.
11.10 Quiz: More Timeline
Before this quiz starts, I want to talk testing strategy.
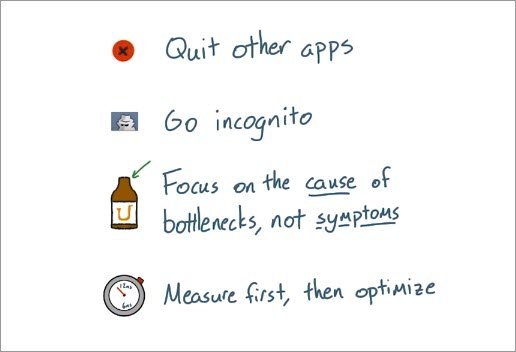
First off, you want to make sure that you’re collecting clean data. So, you should first quit any other apps that you have running besides the browser. Along the same lines, extensions can skew your results. So, make sure you’re running your tests in an incognito window.
You should also recognize that sometimes you may have several bottlenecks in your code, and they may be triggered in different ways from different parts of the pipeline. So, it’s important that you focus on the causes of bottlenecks more than you focus on their symptoms.
And lastly, with any performance issue, make sure you always measure first, before you start to apply fixes. There’s no point in fixing an issue you don’t actually have. And you won’t be able to know how well your fixes actually work unless you’ve measured first, so that you can compare the difference.
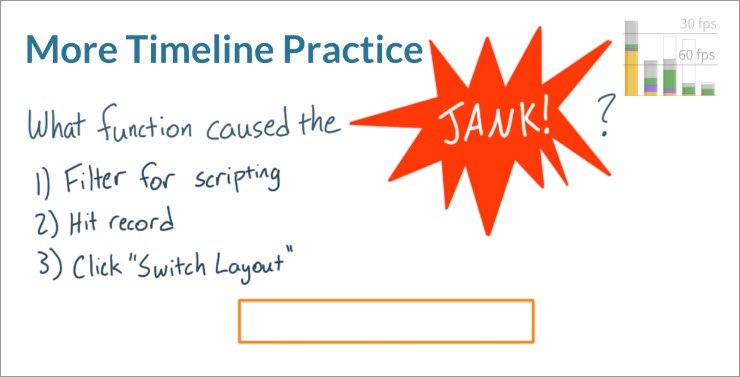
All right. Well, now it’s time for you to practice your DevTools skills and take a timeline recording of this website.
Start recording. Click on the Switch Layout button and then, see if you can figure out where the jank was caused inside the code.Type your answer into this box.
3.10 Solution
Okay, here’s my timeline. But you know, sometimes you can have a pretty good idea of where the cause of jank might be found in the pipeline, but other times it could be kind of tricky to find.
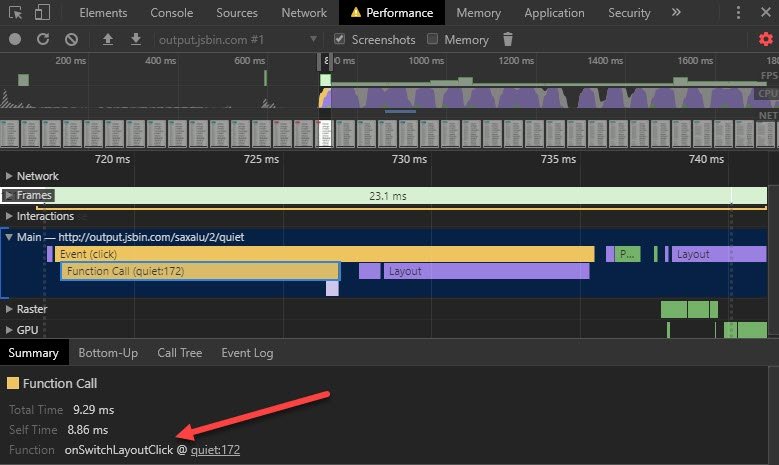
Now, I see a bunch of frames here, and it looks like the last scripting thing to happen before all the layouts happened right here. So, I’ll go ahead and zoom in. I clicked on this last scripting event. I zoomed in a little bit further to see that this event caused a function to run, I’ll click on it in see that it’s location is in this quiet file at line 172.Click on that to see what it’s referring to in fact this functionOn switch layout click is definitely the culprit that i’m looking for here.

Toggling wide on the body is causing all of those janky long layouts. So, the correct answer is the function onSwitchLayoutClick.
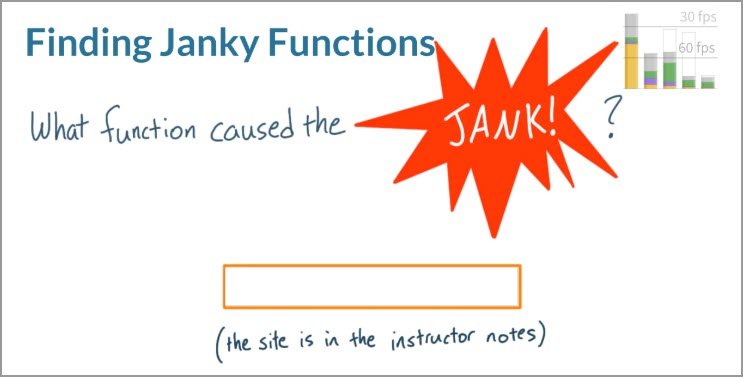
11.11 Quiz: Finding Jank
Here’s another link to a website. Just like before, hit Record and hit Switch Layout.
Record a timeline trace, and see if you can figure out where the jank is coming from. Once you think you’ve found the source of the Jank, type the name of the function into this box.
11.11 Solution
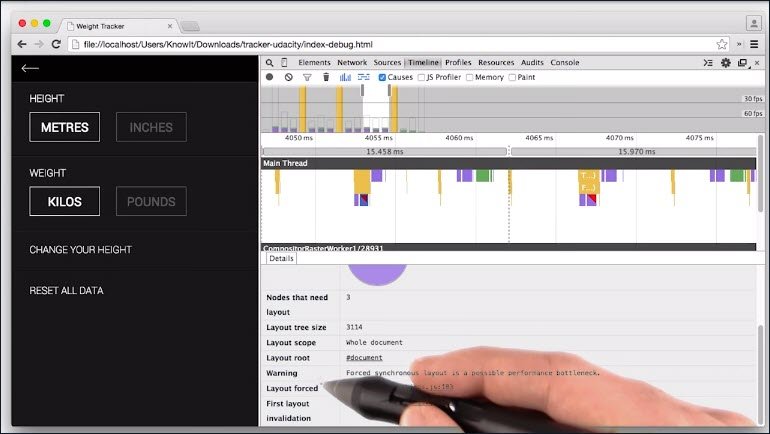
The trace for the site is looking actually pretty close to 60 frames per second, but it’s not quite there. All the big purple bars are a pretty good indication that there’s probably too much layout happening.

Just like before, I want to find the cause of the jank, so I’ll zoom into the beginning of the trace to see what started this mess. When I zoomed in it becomes pretty apparent that there’s something wrong with these layouts. These red triangles definitely look like warning signs to me.
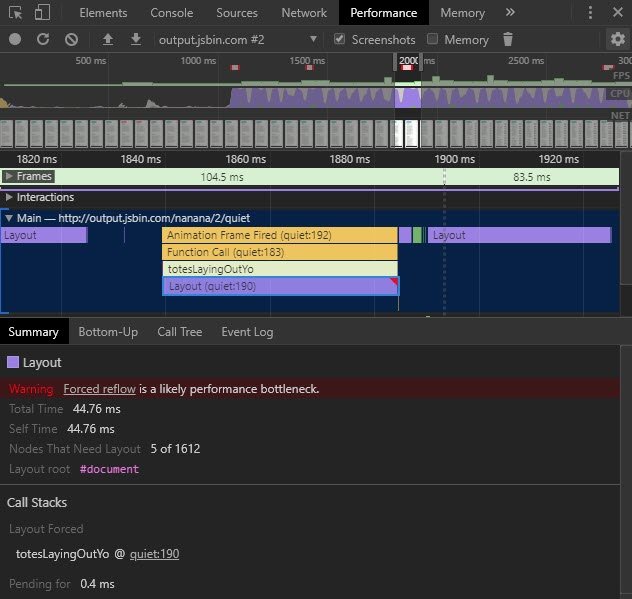
I’ve clicked on one, and then inside the Details pane I see a warning. The warning says that, “Forced reflow is a likely performance bottleneck.” Well, this seems like a pretty useful message, and where’s it happening?
On a function called totesLayingOutYo. Well, it’s coming in at the quiet script on line 190. I think this might be the culprit. Just to make sure, I’ve clicked on the function that led to this forced reflow layout, and it’s pointing me to the quiet script, too.
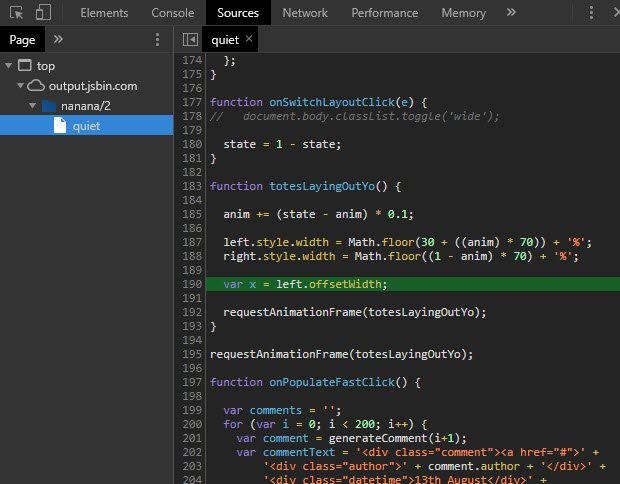
And there it is totesLayingOutYo on line 190, he’s setting offset width which is forcing layout. And there you have it, there’s the source of the jank.
This time the jank wasn’t caused by the function that started it. But, in fact, it’s a function that’s being called every time a new frame has to be run. So the jank isn’t caused by a function running at the beginning of the script, it’s a function that’s being called every frame by requestAnimationFrame.
This means the correct answer is totesLayingOutYo.
By the way, Paul and I will come back to this example later on in the course. You’ll learn just a little bit more about what you’re seeing here and what this performance issue is.
11.12 Quiz: More Jank
In the instructor notes, you’ll find a link to this kind of terrifying website.

It may not look like much now but click this animate button and see what happens.
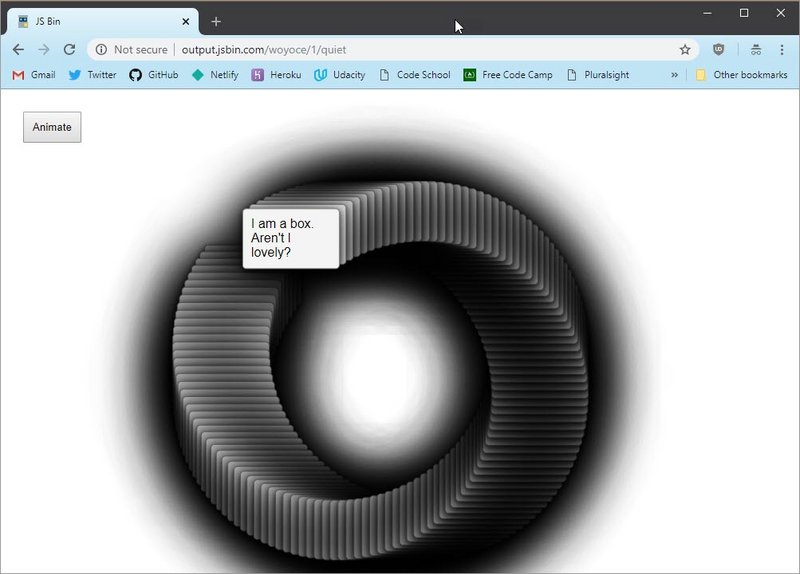
So this is a really super janky animation. Even on a new MacBook Pro, this thing barely chugs along. What I want you to do is record a timeline trace of what happens when you click the Animate button.
When you’ve got the timeline play with it along with the tabs and see which works better for you as you’re analyzing the website.
Just like before, I want you to find where the ridiculous Jank in the timeline is coming from. So what is causing it? Pick one of these answers.

11.12 Solution
I’m seeing a lot of green in the timeline, which is a pretty good indication that there’s a Paint problem.
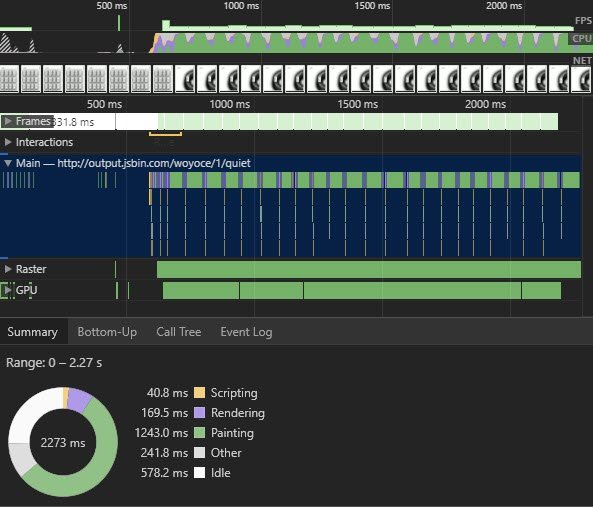
I’ll go ahead and zoom into one of these frames. It looks like each frame is starting with the script. There’s an Animation Frame Fired followed immediately by style calculations and then a Paint.
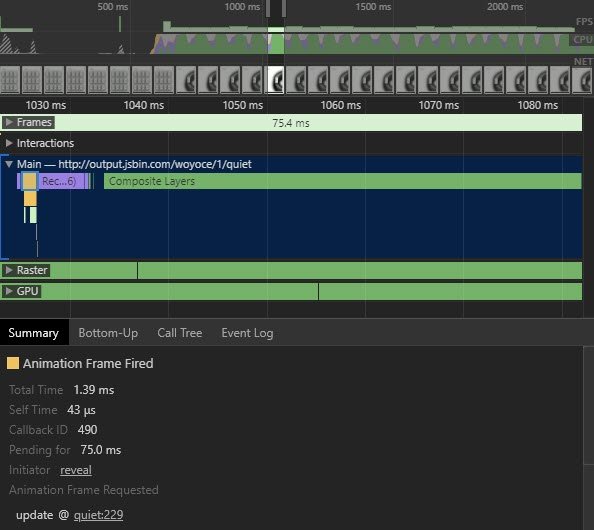
This looks like a JavaScript problem because if the problem was coming from CSS, then chances are I wouldn’t be seeing an animation frame being fired.
So in the end it’s pretty clear that there is a paint problem and it’s being caused by JavaScript.
11.13 Lesson Outro
So now you know how to spot jank using DevTools and you’re getting into the details of where jank is coming from in the pipeline.
In the next lesson, you’ll dive into the details just a little bit more as you look at the common causes of jank and how you can fix them.
12. JavaScript Debug
12.1 Lesson Intro
Let’s take stock of where you are in your 60 frames a second journey, so to speak.
- You know what goes into making a frame and how different styles affect the pipeline.
- You know about how to prioritize your performance work based on RAIL. (LIAR)
- You know about the application life cycle and Chrome DevTools timeline.
Now you are going to step into the common causes of jank that crop up time and time again. You’ll use dev tools to find those problems, fix them, and test the results.
You’ll be starting at the beginning of the pipeline with JavaScript.
12.2 Just In Time
Okay, the first thing you need to know about JavaScript, is that the code you write, isn’t actually the code that runs. Now that may sound a little strange if you never heard it before, but it comes about because of the fact that modern JavaScript engines recompile your code to something that can run more quickly. It’s done thru a Just In Time compiler, or JIT.
A JIT compiler will optimize the JavaScript bit by bit as it runs, and it’s a brilliant but extremely complex engine. For us as developers, what that means is that there’s no way to look at JavaScript and know exactly what code will run in the engine.
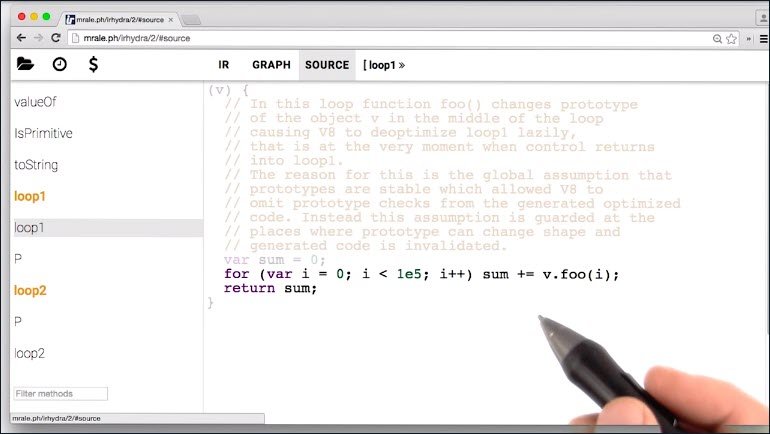
Take a look at this JavaScript code here. It’s a for loop, it’s pretty simple. But if we use this tool called IRHydra to look at how Chrome’s JavaScript engine V8 would look at representing it, it looks like this.
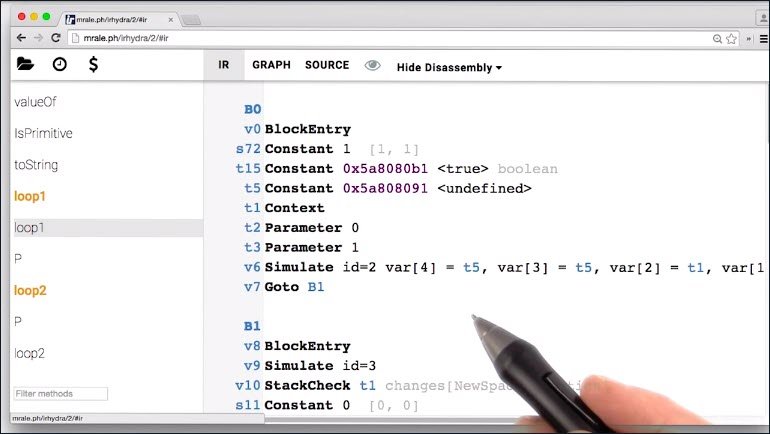
Now you don’t need to understand any of this. This is just how Chrome and its V8 JavaScript Engine understands the code that you wrote. But what I want you to take away here is that you should avoid what we call micro-optimizations.
Micro-optimizations come about when you try to write code that you would think would be a little bit faster for a browser to run. Like say, which is faster, this for loop or this while loop?
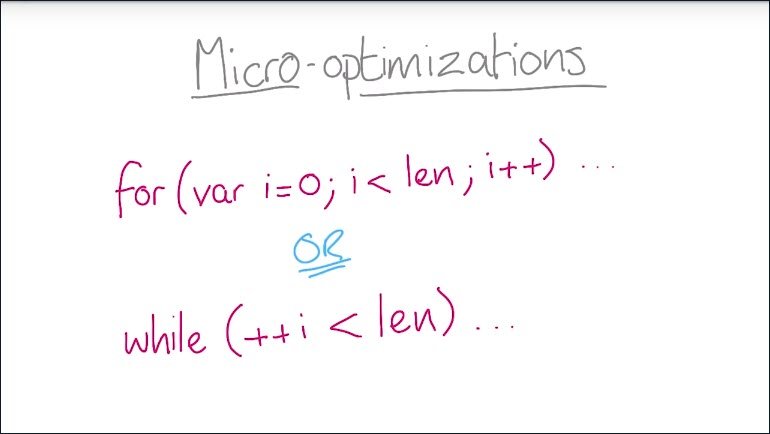
But the thing is, we don’t know how the JavaScript engine is going to treat these two pieces of code. So there’s no point in guessing. Any micro-optimization you write should be a last resort once you’ve exhausted all your other options.
In short, what I’m saying is don’t spend your time comparing similar pieces of JavaScript in this way. It won’t help you. There are other things you can do to improve performance that don’t involve micro-optimizations.
So you’re done, right? I mean, you can’t guess exactly how a JavaScript engine is going to handle your code. So obviously we can move on. Well, no, actually. It turns out there are plenty of things that you can do to make your code run better.So let’s get started
12.3 Quiz: JS Optimize for Animation
While you shouldn’t concern yourself with micro-optimizations like this one, there are obviously steps you can take to ease JavaScript’s burden on the rendering pipeline.
Think back to the different stages of RAIL. Each stage has a different window of time to execute JavaScript without incurring a user experience penalty. That is to say, you have a small amount of time to execute JavaScript, and if all of it happens before the window of time is over, the app will still feel snappy and smooth.
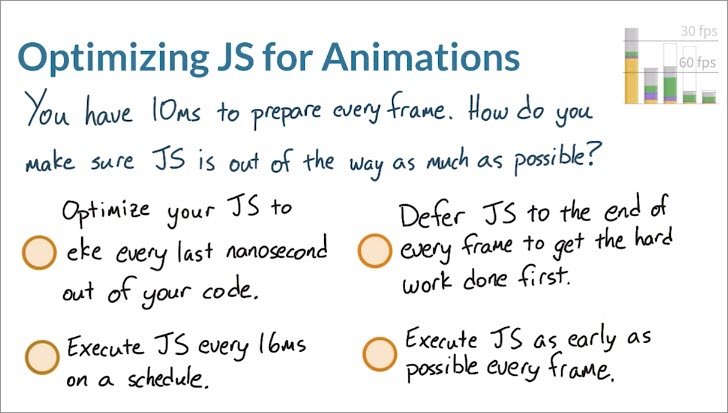
Looking at this time frame for an animation, you realistically only have about ten milliseconds to do everything you need to do to prepare the frame, which includes running layout, compositing, and paint.
So, with that in mind, how do you make sure JavaScript is out of the way as much as possible to hit that ten-millisecond deadline? Pick one of these four answers.
12.3 Solution
As JS can trigger every part of the rendering pipeline, it makes sense to run it as early as possible each frame.

- For the first one, no. Remember, micro-optimizations really aren’t that helpful.
- For the second one, not quite. While it may seem like a good idea to execute JavaScript on a 16 millisecond schedule, this doesn’t necessarily guarantee that JavaScript is always executing at the right time for each frame.
- The third one isn’t right either. You need to make sure that JavaScript is done as early as possible, because it can lead to style calculations, layout, and paint. In fact, this answer doesn’t even really make sense, because the frame is done when the pixels are painted.
- The last answer is correct. The beginning of every frame is definitely the best time to run JavaScript because remember, it can create style, layout, paint and compositing changes. And finishing JavaScript early means you have as much time as possible to take care of everything else.
In the next video, you will learn about request animation frame which is an API that will schedule your JavaScript to run at the right point of every frame.
12.4 requestAnimationFrame
RequestAnimationFrame should be your go to tool for creating animations.
Nobody likes to be interrupted in the middle of a task, and the browser is no different. Remember how little time the browser has to render the frame at 60 frames a second.
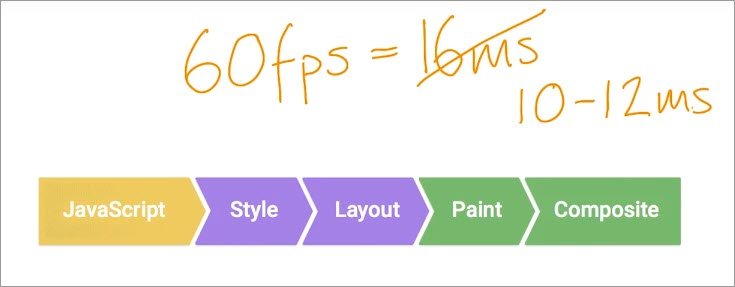
If one second is a thousand milliseconds and we have to fit 60 frames in, well we have 16 milliseconds.
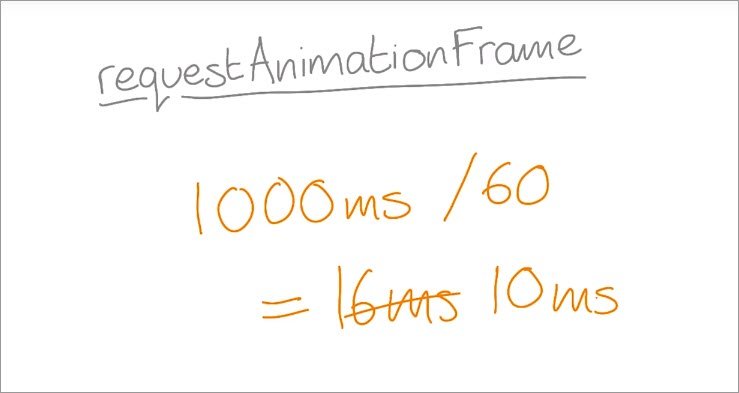
Realistically though, there’s some overhead to running a frame and the browser has housekeeping to do. So we should aim for about 10 milliseconds instead.
The JavaScript part of your frame should typically be kept around three to four milliseconds at most. Because there’s going to be other work, like style calculations,layer management, and compositing that will come afterwords.

I want you to imagine that the browser is in the middle of doing some style work. And then, in comes some JavaScript that needs attention. The browser now has to deal with the JavaScript that just came in before it can move on to other tasks. That new JavaScript may cause the work for the frame to be redone, and that could well mean missing the frame.
RequestAnimationFrame schedules your JavaScript to run at the earliest possible moment in each frame. That gives the browser as much time as possible to run your code, then style, then the layout, painting, and compositing.
A lot of older code around the web that is used for animation, uses setTimeout or setInterval, because back in the day that’s all there was. In fact, jQuery still uses setTimeout for its animation today.
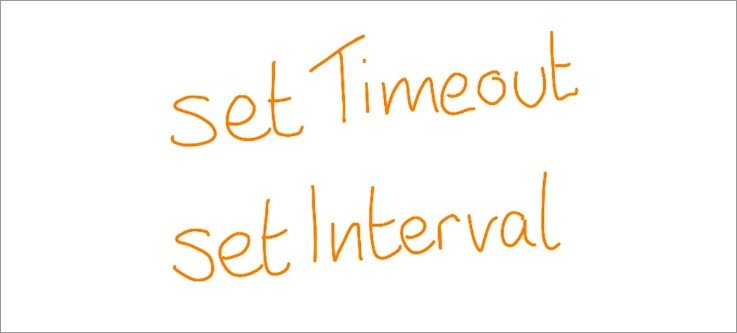
The problem with both of these functions is that the JavaScript engine pays no attention to the rendering pipeline when scheduling these. They’re good functions to use when you want to wait some time to elapse or do some repeated task every so often, but they’re not a good fit for animations.
This is how you use requestAnimationFrame .You make a call to it and tell it which function you want it to call. That gets called where you do your animation. And at the end of it you schedule the next one. The browser takes care of when it should run and how.

Of the many browsers available to users today, the only one that doesn’t support requestAnimationFrame is Internet Explorer 9. So, for that you’d need to use a polyfill, which would use setTimeout. It’s not ideal as a fall back, but it will allow you at least to use requestAnimationFrame in your code and not worry about compatibility.
12.5 JavaScript Profile
Hopefully, all your JavaScript is running at the right time in the frame. And that’s great. But now, you need to make sure that it’s not taking too long to run.
Remember that to meet 60 frames a second you have to fit all the work inside 16 milliseconds. And that’s not just JavaScript but everything for our frame.
In reality, we have to be inside of ten to twelve milliseconds to leave the browser some time for it’s housekeeping. It’s easy for JavaScript to take quite some time to run, especially if you are using frameworks and libraries because they will need some time to do their work. Whether that’s organizing views in your app or handling callbacks or perhaps, even analyzing data.
In previous versions of Chrome DevTools we had to explicitly turn on the JavaScript Profiler when taking a recording in order to get detailed info on which functions were called, when, and for how long.
This is no longer the case. Now we can get this information from the Bottom Up, Call Tree, or Event Log panel.
The timeline also shows the call stack when we zoom in enough.
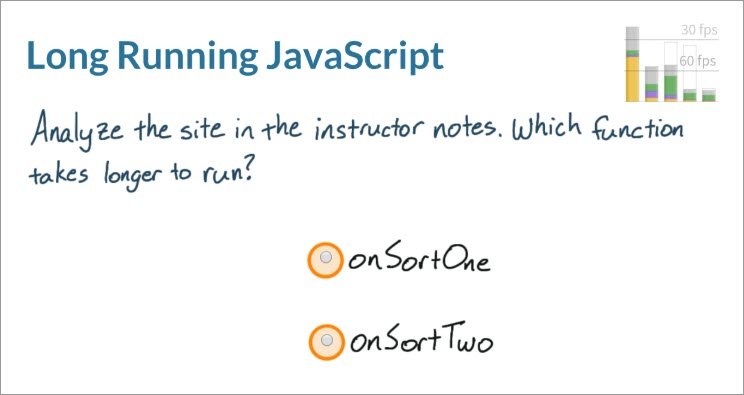
12.6 Quiz: Long Running JS
For this quiz, you’re going to be comparing the time it takes two functions to run. One function will run when you hit Sort by name, and the other when you hit Sort by number.
I want you to use DevTools to analyze what happens when you hit these two buttons. One of these buttons will take longer to sort this list than the other.
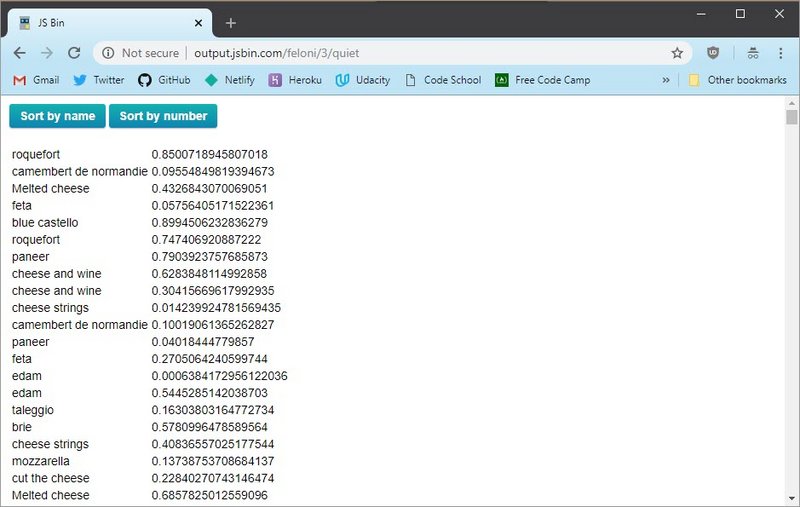
I’ll give you a hint that the slow function, one of these two, is going to be using a bubble sort which happens to be super, super slow.
The other of these two functions is going to be using JavaScript’s built in sort function which is way faster. The point of this quiz question isn’t necessarily about which sort function you should use, though in fact the built in one is normally great.
This question is about being able to see, at a glance, how much work is going into a frame.
12.6 Solution
I hit record and then I hit both buttons. On first look it’s pretty obvious to see what’s going on here. Here’s the first click and here’s the second one. As a child of the first click event onSortOne ran. And, as a child of the second click event onSortTwo ran.
And just looking here it’s pretty obvious that onSortOne took longer to run.

Before I move on, I want to point out some interesting bits in this little sample. If you’re in the flame view and you click on the top-level click record like this one here, you can pull up the details pane for some useful information.
This pie chart gives you an idea of how much time it took different events caused by this function to run. You can get the scripting time for this function itself, which tells you how long it took just this function to run. And if this function called any others, which this one did, then you can see how long it took it’s children to run.
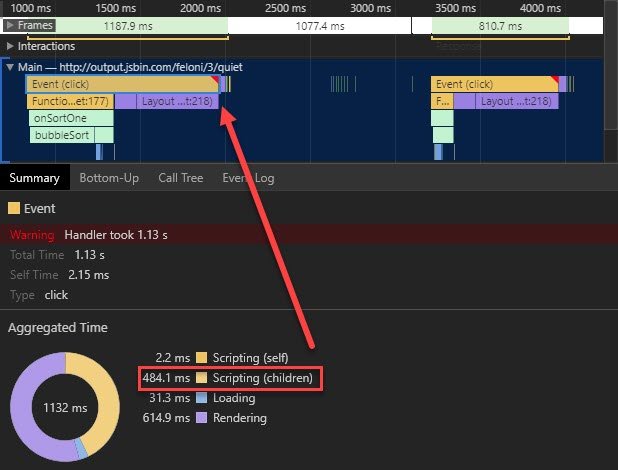
In this case the function that ran on the click called other functions including the bubbleSort one, which is included in this children scripting time.

I’ve changed over to the second click event for the second event and you can see that the scripting time for its children, is only 96 milliseconds, compared to 484 milliseconds.
I want you to notice one other thing. After the first click there is a recalculate style and then a layout event, and after the second click there is another recalculate style and another layout event.
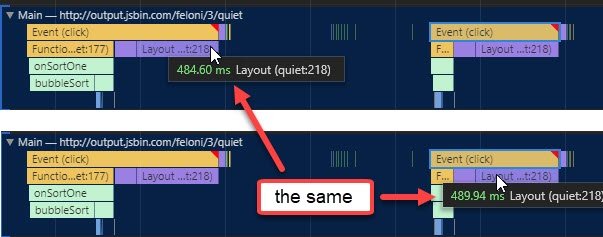
These two pairs of recalculate style and layout are essentially the same length. This is a clear indication that no matter how you sort the data in this example, you still have to write out the whole table of results, which is going to require recalculating styles, relaying out the page, and repainting everything.
So with all that in mind, answer one took longer to run.
12.7 Quiz: Web Workers
Web Workers are really super useful, so you’re going to be creating one for this next quiz.
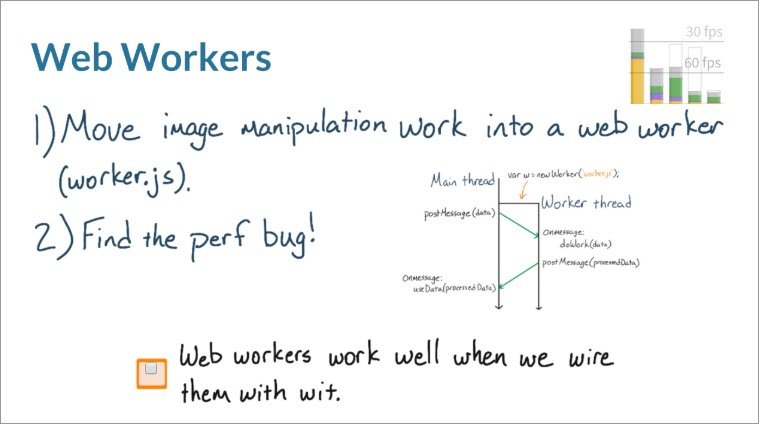
Web workers provide an interface for spawning scripts to run in the background. Normally, websites run in a single thread running on the operating system. Web workers allow you to run JavaScript in a totally different scope than the main window and on a totally separate operating system thread.
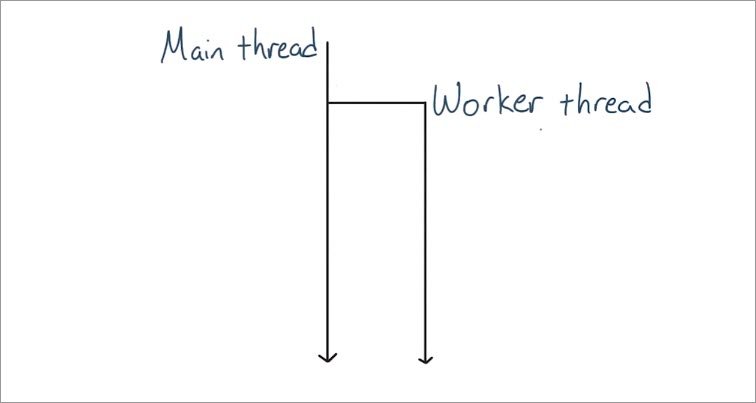
Whatever work is happening in the main thread, in the main window, won’t affect or be affected by the worker thread. And of course the opposite is true. Whatever work is happening in the worker thread won’t affect or be affected by the main window, but the two can send messages back and forth.
This means that you can isolate long running JavaScript inside a worker thread and allow the main thread to run free unimpeded.
What’s really cool though is that the web worker and the main thread can communicate with each other. Altogether, web workers are an incredibly valuable strategy for running long running code that does not create any jank on the main thread.
Essentially you’ll need to create a separate JavaScript file which your main app will spawn into a new web worker.
var w = new Worker('worker.js);
For this quiz I want you to download and dejankify this small app.
I want to point out the two main features of this app.
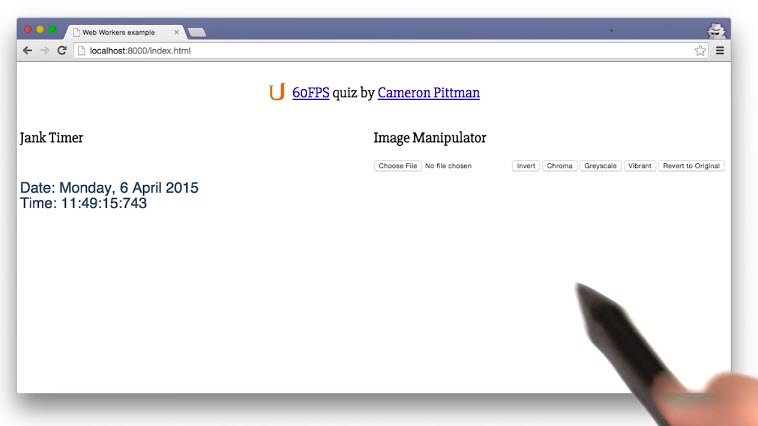
On the left side there is the Jank Timer which will tell you if any jank appears on the page. And on the right side there’s the image manipulator, which will let you pick a file from your local machine and then do some type of image manipulation on it.
In this case I’ve just gone ahead and uploaded a Chrome logo. The image manipulator’s janky and needs a little bit of work. Watch what happens when i click invert.
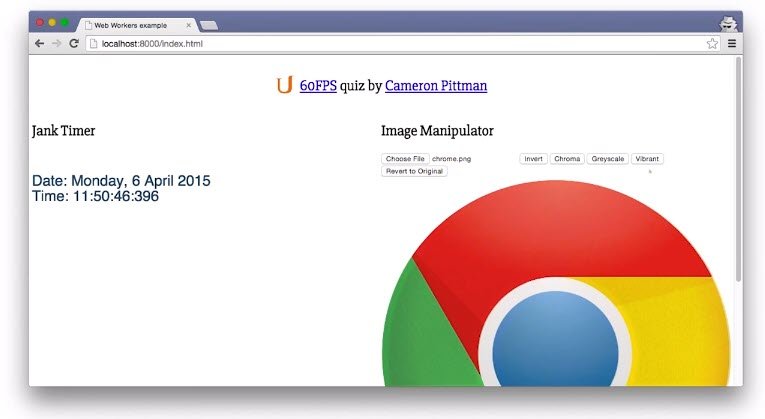
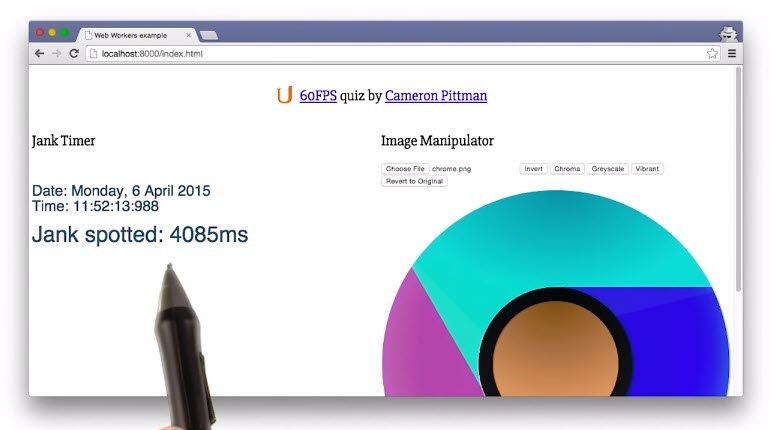
The page froze for more than four seconds as this image was being inverted. That is definitely a lot of jank and that needs to be fixed.
Your job for this quiz is to offload the image manipulation work from the main thread into a web worker.
You know you’ve done it correctly when the page doesn’t freeze for multiple seconds when you click one of these buttons.
As a second challenge, there’s also a massive performance bug in the way the image manipulators run.
12.7 Resource Links
- Image manipulation repo - App to download and de-jankify
- Web Worker docs - on MDN
- Web Workers - on HTML5 Rocks
12.7 Solution
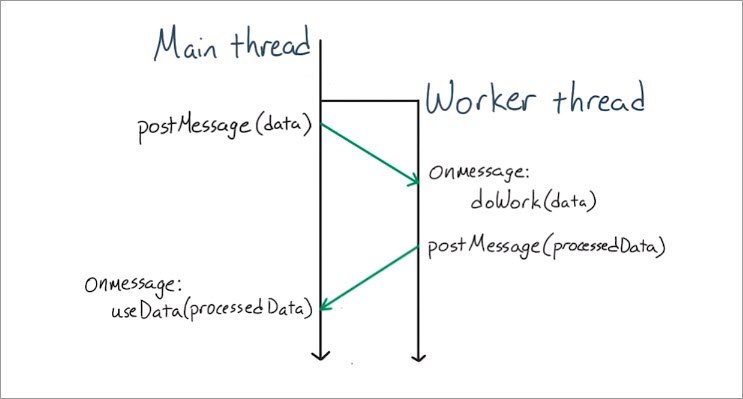
It makes sense to start by taking a look at worker.js. Notice that when it receives a message from the main thread, it’s going to get two things, the image data and the type of manipulation.
worker.js
importScripts('imageManips.js');

this.onmessage = function (e) {
  var imageData = e.data.imageData;
  var type = e.data.type;

  var a, b, g, i, j, length, pixel, r, ref;
  try {
    length = imageData.data.length / 4;
    var manipulatePixel = getManipFunc(type);
    for (i = j = 0, ref = length;
      0 <= ref ? j <= ref : j >= ref;
      i = 0 <= ref ? ++j : --j) {
      r = imageData.data[i * 4 + 0];
      g = imageData.data[i * 4 + 1];
      b = imageData.data[i * 4 + 2];
      a = imageData.data[i * 4 + 3];
      // pixel = manipulate(type, r, g, b, a);
      pixel = manipulatePixel(r, g, b, a);
      imageData.data[i * 4 + 0] = pixel[0];
      imageData.data[i * 4 + 1] = pixel[1];
      imageData.data[i * 4 + 2] = pixel[2];
      imageData.data[i * 4 + 3] = pixel[3];
    }
    self.postMessage(imageData);
  } catch (e) {
    throw new ManipulationException('Image manipulation error');
  }
};

function ManipulationException(message) {
  this.name = "ManipulationException";
  this.message = message;
}
e is the whole message from the main thread. And then the data is the user data that we’re sending to the worker. So, when I post a message to the web worker, I’ll make sure that both of these are included.
Back in the image app, notice that the loop is gone from manipulateImage. That’s because the loop now lives in worker.js. At the top of the script, I created the web worker from worker.js andI just called it imageWorker.
image-app.js
(function(){
  var original;
  var imageLoader = document.querySelector('#imageLoader');
  imageLoader.addEventListener('change', handleImage, false);
  var canvas = document.querySelector('#image');
  var ctx = canvas.getContext('2d');

  // Add web worker
  var imageWorker = new Worker('scripts/worker.js');
  imageWorker.onmessage = (e) => {
    toggleButtonsAbledness();
    return ctx.putImageData(e.data, 0, 0);
  };
  imageWorker.onerror = (e) => {
    function WorkerException(message) {
      this.name = 'WorkerException';
      this.message = message;
    }
    throw new WorkerException('Worker error.');
  };

  function manipulateImage(type) {
    var imageData;
    imageData = ctx.getImageData(0, 0, canvas.width, canvas.height);

    toggleButtonsAbledness();

    let data = { 'imageData': imageData, 'type': type };
    imageWorker.postMessage(data);
  }
})();
When I’m ready for the worker to start doing its work, I’ll simply post a message to it by calling postMessage on the variable for the worker that I created above.
Next up there’s the onmessage handler that’s attached to the web worker. This function gets run once the web worker returns something back to the main thread.
As a good practice, I also included an onerror handler on the web worker. It also calls a function, which in this case throws a web worker exception.
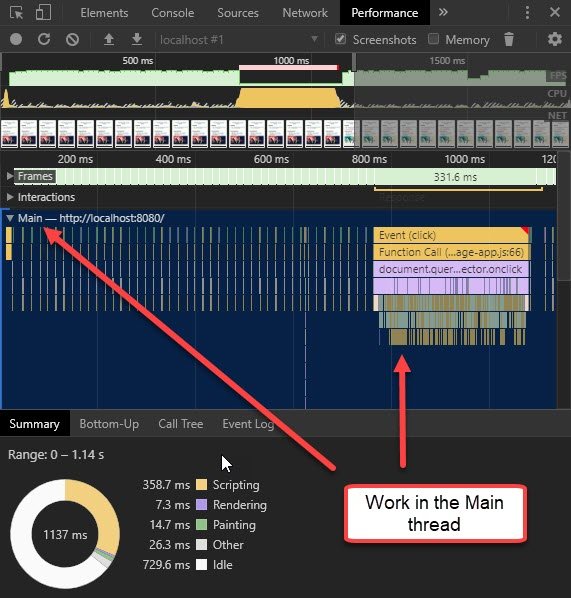
Processing done in Main thread (non-web worker solution)
All right. Now let’s see how all of this runs. I’ve opened the solution in the browser and I’ve loaded my own image.

This first run will be with the old code. When I hit Invert I get a jank reading of 243ms.
Here’s the detail reading
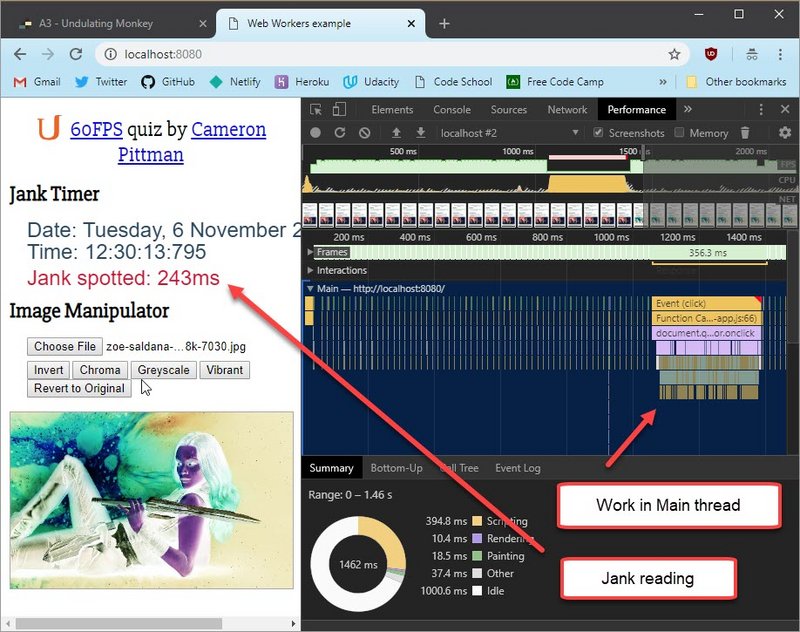
Processing done in Web Worker
Next I load up the web worker solution. I’ll hit Invert and watch. No Jank, it doesn’t freeze up, and then a few seconds later, the inverted image appears
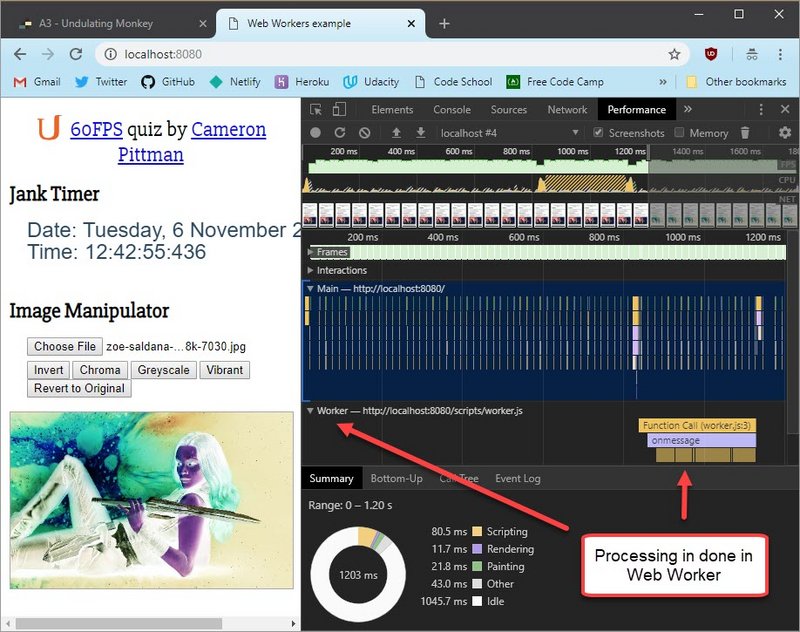
Here is the detail view.
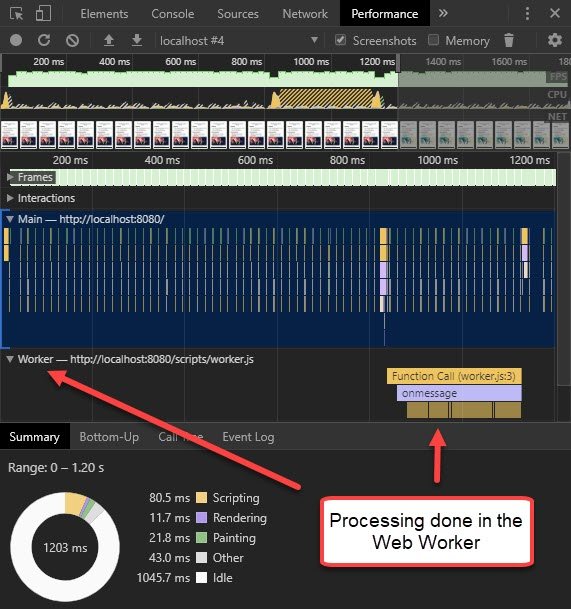
Notice that there was no huge stutter. There was no Jank appearing in the timer. That’s a really good sign that the image manipulation work, is happening off the main thread.
Notice how the main thread stays at 60 frames per second the whole time. That’s awesome. And also you can see the processing has been offloaded from the main thread into the Worker thread. Very cool.
12.8 JS Memory Management
Finally, I want to point out one other aspect of JavaScript. And that is memory management approach. JavaScript is garbage collected, which means for us developers, we don’t need to worry about pointers, deleting objects, or how to handle local variables, any of that.
We can just declare things like this var x = { ... } and forget about them. The downside is that the JavaScript engine has to handle that itself, and when it decides to run the garbage collector, nothing else runs. This can trigger visible pauses in rendering the page.
Like I said earlier, the JavaScript you write isn’t the JavaScript that runs, thanks to JIT. So it’s not always easy to predict whether your code is going to be garbagey. It also depends heavily on the frameworks and libraries you use, and how you structure your code. That’s why you need to measure first.
Well, the good news is that Chrome’s DevTools will show you memory usage in your projects. Okay, take a look at this undulating-monkey project. I made this a while ago. Don’t ask me, it’s pretty weird. I’m not sure what kind of mood I was in that day.

What we can do is, we can see the memory usage of this demo in Chrome DevTools. You can see I’ve checked the Memory box before running the profiler.
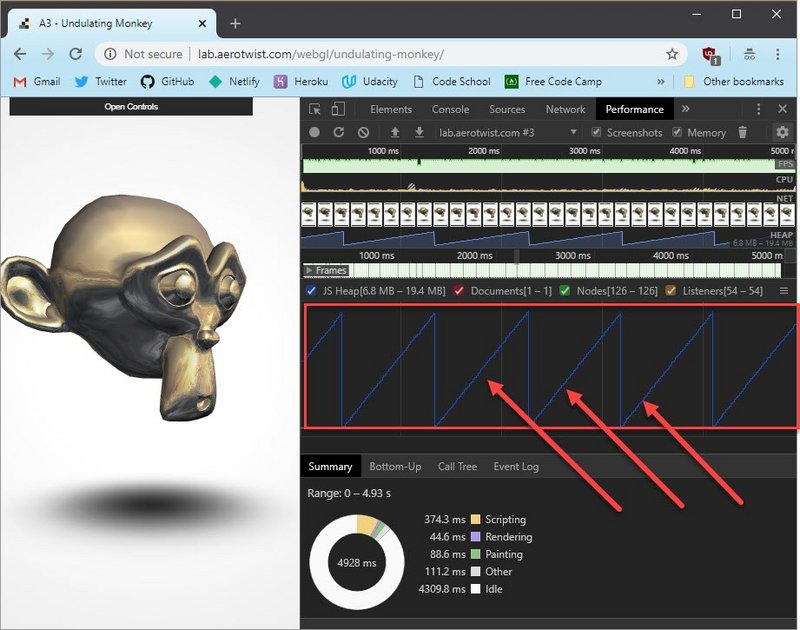
What we see is this sawtooth pattern here and that’s actually fine. We expect JavaScript to use some memory and eventually, when this drop-off happens, that’s the garbage collector running.
There are two things we’re looking for here.
- Firstly, are there a lot of fast climbs? That can indicate that we’re assigning a lot of memory very quickly and very often.
- Secondly, when the garbage collector runs, does it take it back to zero? If not, we might have a memory leak.
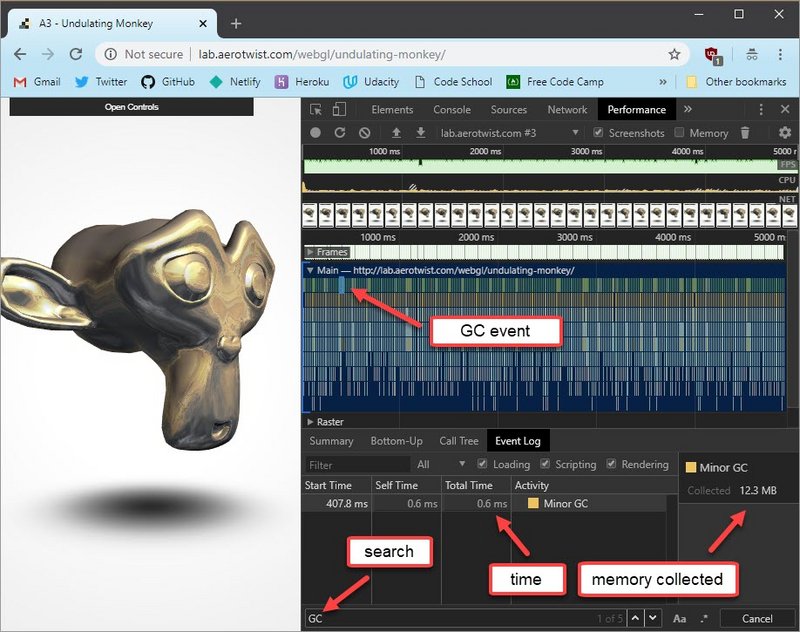
If we’re interested in a little more detail on the garbage collection, we can switch off the memory profiler and then go to the search down here.If that’s not on your screen, you can hit Cmd+F or Ctrl+F.
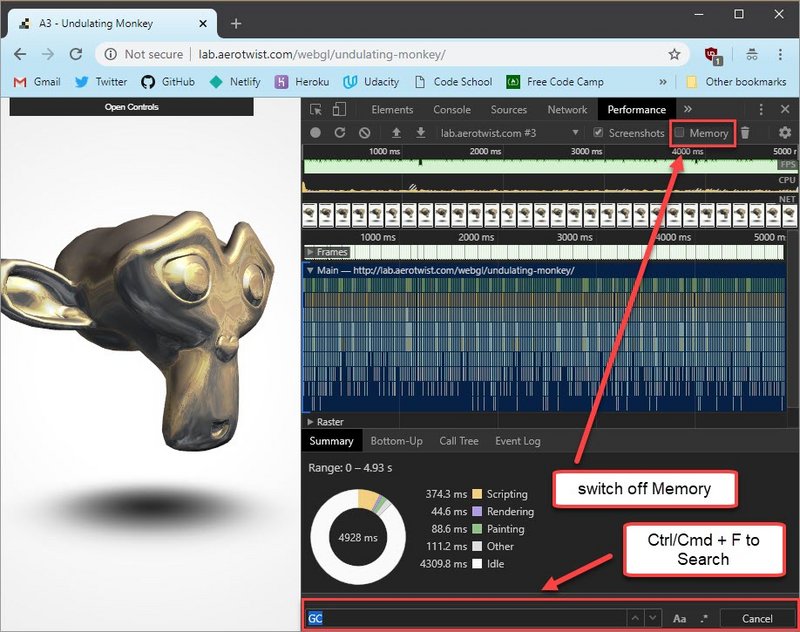
Enter GC into the field. And then hit Enter.In my case, I’ve got five results.
I can step through them with these arrows. And you can see, for example, I’m only spending a fraction of a millisecond here.
If you find that you’re missing frames because of garbage collection, then there are some fabulous resources you can use to learn more about patterns and practices that will help you avoid creating too much garbage.
Check out these links for more information.
Garbage Collection Resources
- Undulating Monkey
- Writing Fast, Memory-Efficient JavaScript on Smashing Magazine
- Memory Management on MDN
- High-Performance, Garbage-Collector-Friendly Code on Build New Games
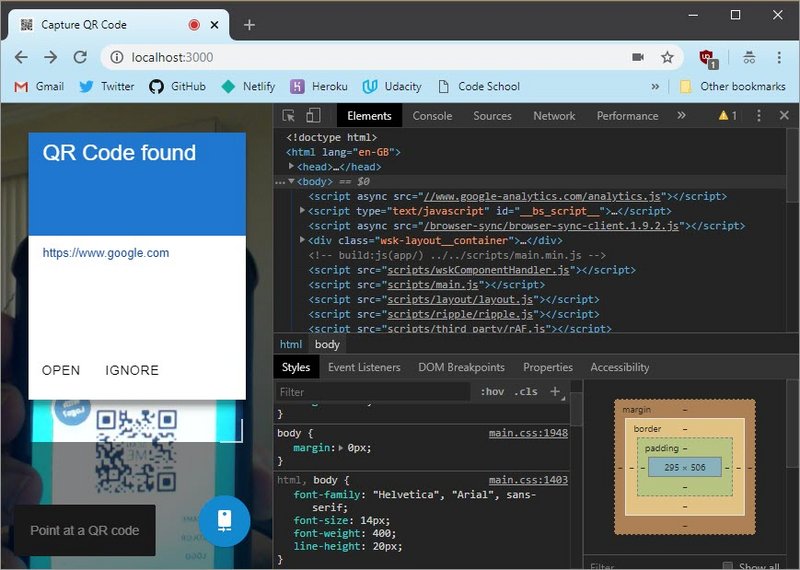
12.9 Quiz: QR Code App 1
This is a QR code app that Paul Kinlan put together.
You’ll need a copy on your local machine, so follow these instructions.
Here’s a link to the QR Code App repo Build instructions:
- Clone the repo
- Update the gulp-sass line (#18) in package.json to
"gulp-sass": "^3.1.0", - Install npm
- Install Gulp
- Run
npm installin the QR Code App directory - Build and run with
gulp serve
This is a really cool app, but right now it’s a bit janky.
In this first quiz, you’ll be replacing setInterval with requestAnimationFrame. And in the second quiz you’ll be moving all the image decoding work off the main thread and into a web worker.
Before you start working on the app, you’ll need to install gulp if you don’t already have it. Once you install gulp, run npm install to get all the dependencies, and that will allow you to run gulp serve to build and then serve the web site.
gulp serve also watches all your files for changes. So if you save a change to any of the JavaScript files, it’ll automatically rebuild and refresh the page.
So for this quiz navigate to app/scripts/main.js in your favorite text editor and start using requestAnimationFrame. Build and run the page with gulp serve.
You’ll know you’ve done it properly when the app loads and you see “Animation Frame Fired” in the timeline. When you’re done check this box to let us know that you’re firing animation frames.
12.9 Solution
Here’s the Performance panel recording of the QR Code app prior to any changes. it’s using setInterval for its polling.
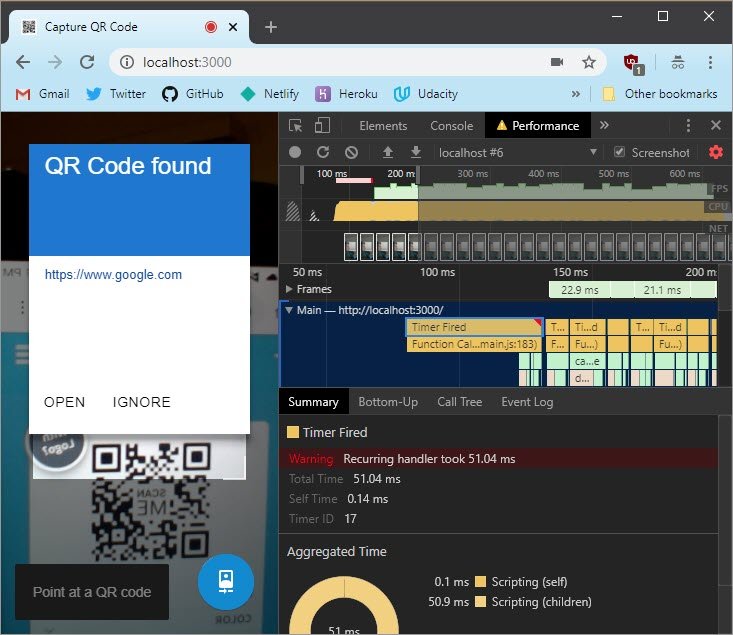
It shows a warning on “Timer Fired” and show that the handler took 51ms to complete.
I’m main.js I went to find setInterval the easy way by using Cmd+F. It looks like setInterval is repeating on a four millisecond timer, which is actually a little ridiculous.
I go ahead and remove that and replace setInterval with requestAnimationFrame.
  var isSetup = setupVariables(e);
  if(isSetup) {
    // setInterval(captureFrame.bind(self), 4);
    requestAnimationFrame(captureFrame.bind(self));
  }
  else {
    // This is just to get around the fact that the videoWidth is not
    // available in Firefox until sometime after the data has loaded.
    setTimeout(function() {
      setupVariables(e);

      // setInterval(captureFrame.bind(self), 4);
      requestAnimationFrame(captureFrame.bind(self));
    }, 100);
  }
Okay, now, that’s simple enough but remember, the function itself also needs to call requestAnimationFrame. Here’s the function captureFrame which is running the animation. And inside, I will make another call to requestAnimationFrame to the same function.
var captureFrame = function() {
  // Work out which part of the video to capture and apply to canvas.
  canvas.drawImage(cameraVideo, sx /scaleFactor, sy/scaleFactor,
    sWidth/scaleFactor, sHeight/scaleFactor, dx, dy, dWidth, dHeight);

  drawOverlay(dWidth, dHeight, scaleFactor);

  // A frame has been captured.
  if(self.onframe) self.onframe();

  coordinatesHaveChanged = false;

  requestAnimationFrame(captureFrame);  //   <- add this
};
I’ll save it, and let’s see what it looks like. I record it and look at the timeline. It looks like “Animation Frame Fire”d is being called over and over.

So it looks like the job here is done. All right, well, now it’s on to the Web Worker.
12.10 Quiz: QR Code App 2
Right now, the QR code app is doing all of the image decoding on the main thread. It’s hard work, and it sometimes introduces a bit of jank to the app. This is actually a perfect situation for Web Workers.
Image decoding can be handled in a separate thread by a worker while the main thread is simply concerned with delivering 60 frame per second video. The main thread can send off image data to the worker so it can do its analysis. And then when it’s done, the worker will simply post the data back to the main thread.
In this case, the processed data that the worker thread will be sending back to the main thread is simply a URL if the QR code was resolved, or undefined, if not.
Here are the steps to refactor this app:
- Use this Web Worker:
app/scripts/qrworker.js - Create Web Worker in:
QRCodeManagerinapp/scripts/main.js - Send data to worker from:
detectQRCode - Remove unnecessary scripts from:
index.html
12.10 Solution
The first thing I did was open app/scripts/main.js and add in the Web Worker code.
I commented out old call to the decode method and then created a postMessage to send imageData to the Worker. Next I added the onmessage listener to receive data back from the Worker.
var QRCodeManager = function(element) {
  var root = document.getElementById(element);
  var canvas = document.getElementById("qr-canvas");
  var qrcodeData = root.querySelector(".QRCodeSuccessDialog-data");
  var qrcodeNavigate = root.querySelector(".QRCodeSuccessDialog-navigate");
  var qrcodeIgnore = root.querySelector(".QRCodeSuccessDialog-ignore");

  var client = new QRClient();
  var qrWorker = new Worker('scripts/jsqrcode/qrworker.js');  // <- here
  // ...

  this.detectQRCode = function(imageData, callback) {
    callback = callback || function() {};

    // client.decode(imageData, function(result) {
    //   if(result !== undefined) {
    //     self.currentUrl = result;
    //   }
    //   callback(result);
    // });

    qrWorker.postMessage(imageData);

    qrWorker.onmessage = function (e) {
      var result = e.data;
      if (result !== undefined) {
        self.currentUrl = result;
      }
      callback(result);
    };
    qrWorker.onerror = function (err) {
      function WorkerException(message) {
        this.name = "WorkerException";
        this.message = message;
      }
      throw new WorkerException('Decoder error');
    };
  };
  // ...
})();
Lastly, I commented out the scripts from index.html since they are now being imported into the Worker.
Here’s the updated Performance recording with two timelines. One for the main thread and another for the worker. Each frame is running at 60 fps or above.
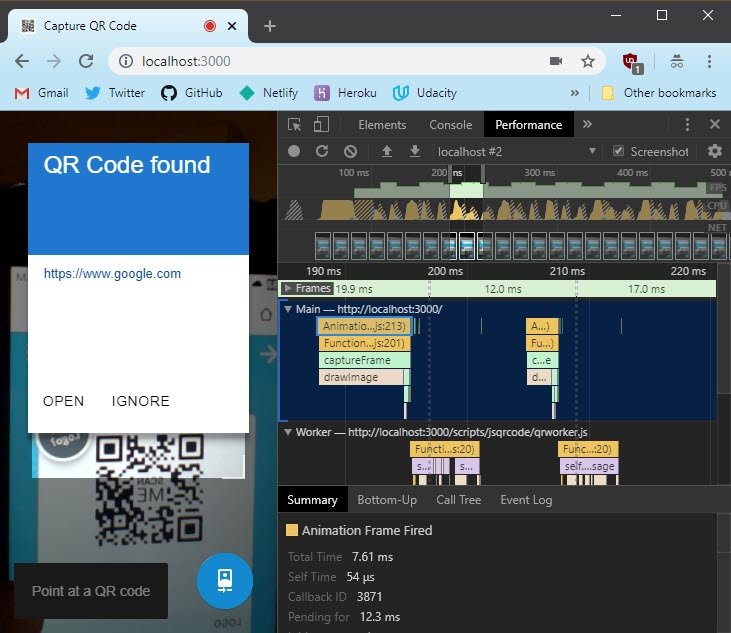
12.11 Lesson Outro
JavaScript profiling takes some practice, but now you know the tools you need to succeed.
So, have a look at your own projects and see if you have some long-running JavaScript or some badly timed JavaScript. See where you can reschedule it, reduce its impact, or just remove it all together.
Now, a lot of people often think at this point, they’re done with their performance work. And if the JavaScript runs well, well there’s nothing else left to do. But that’s not at all true. As you saw earlier, there’s a whole pipeline after the JavaScript runs, and that also needs to fit into that ten to 12-millisecond window. As the developer, you’re in control of that pipeline. You’re the one who decides what the browser does and when.
So in next lesson, we’ll be taking a look at the different kinds of work that JavaScript often triggers. It could trigger style calculations, layout, and paint.
13. Styles and Layout
13.1 Lesson Intro
You’ve started to find and fix issues. Now, hopefully, you’re JavaScript is behaving well, but remember that it’s only a small part of making a frame.
In this lesson, you’ll be tackling styles or, as it’s labeled in DevTools,Recalculate Styles. By the end of this lesson, you’ll be identifying and solving performance issues from style calculations. But bear in mind that JavaScript can often be the trigger for the issues we’re going to cover. But it’s not necessarily JavaScript’s fault. Also, remember from the first lesson that style calculations will take the DOM and then for each element, figure out what its visual properties should be.
So the browser ends up with a Render Tree which is like the DOM. Only it’s, the elements, too, just need to be drawn. So anything that shouldn’t be drawn won’t be in there. So if you set something to display: none, it won’t be there, but if you have something like pseudo-elements, like :before or :after, they will be in this tree, even though they don’t exist in the DOM.
13.2 Quiz: Style Change Cost
For this quiz I want you to make a prediction. What will happen to performance if you change the styles of different elements? Pick one of these four answers.
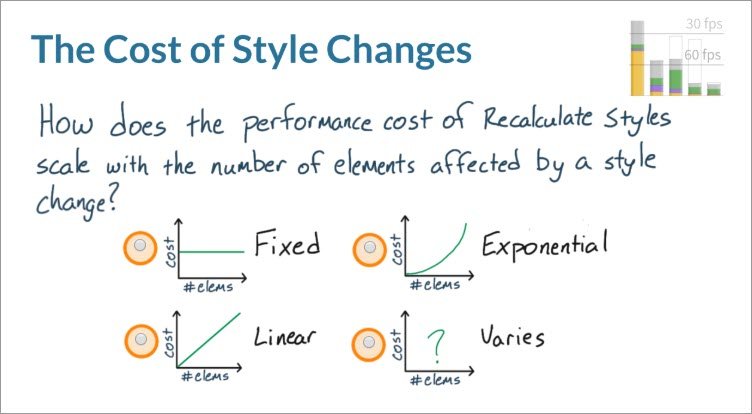
13.2 Solution
As it turns out, it’s actually linear in most cases. There can be cases where it’s more or less expensive than linear but that depends on whether or not you’re using expensive styles which you’ll learn more about in a moment.
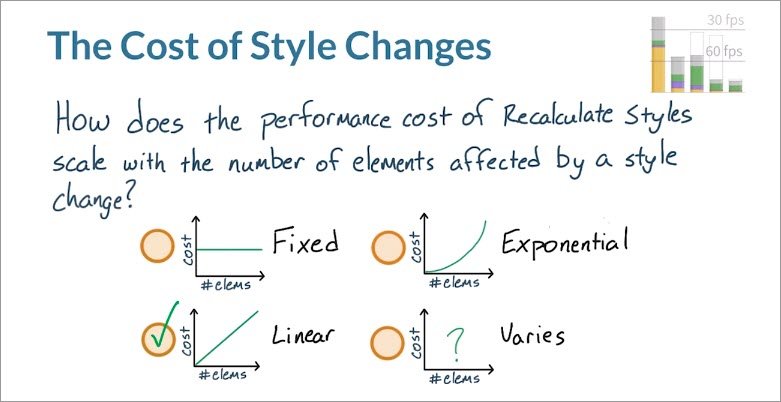
So this means that changing 1,000 elements is roughly ten times more expensive than only changing 100 elements. This is important to keep in mind when you have a page with a lot going on.
13.3 Selector Matching
As well as the number of elements that are involved, you have to factor in selector matching.
Selector matching is the process of figuring out whether some styles should actually apply to any given DOM element. It’s possible to select this div, either with its class .b-3, or with a more complex selector like :nth-child(3).
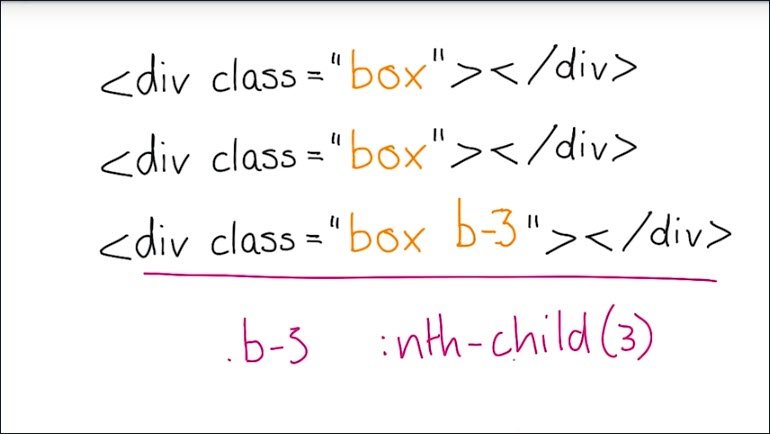
It’s complex, because in order to know if the style applies, it has to figure out if this is the third child, whereas with this, it can simply use the class name.
Now you may be thinking that this shouldn’t matter. And actually for matching a single element, it really doesn’t. And this is a pretty simple example. It’s only going to take a browser a fraction of a millisecond to figure out the match in both cases, but if you have a large number of elements affected by a style change, then the complexity of the selected can really start to matter.
One approach that works very well is BEM, or block, element, modifier. And it’s a way of writing your CSS.

It uses single class names to style elements. And not only does it provide more modular, reusable, and readable styles, it is advantageous to performance, since class matching is often the fastest selector to match for modern browsers.
In the case of the example we just had, you could probably use a class like this.
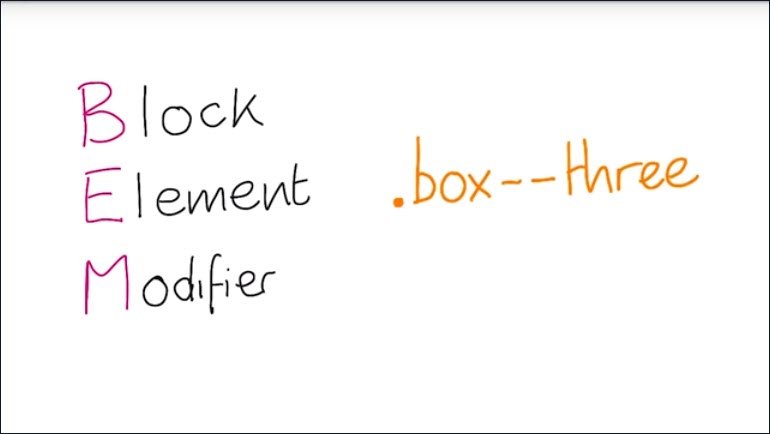
It’s a box which would’ve been the block. There isn’t any element, but the modifier would be, say three, to show that it’s the third box.
If you want to know more about BEM, take a look in the links below. You can use any number of methodologies for keeping your CSS tidy. So if BEM isn’t your thing there are plenty of others you can try. The key thing is, where you can, keep your selector matching simple.
13.3 Link Resources
13.4 Quiz: Selector Matching
We just explained to you how complex CSS selectors add to the browser’s workload.
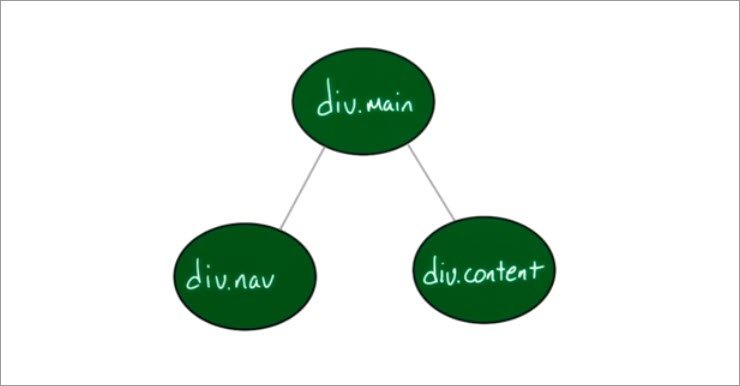
The more complex a selector is, the more browser has to move up and down the DOM tree. The more it has to move up and down the DOM tree,the longer it takes to resolve the right element.
For this quiz, I want you to predict which CSS selector is fastest.
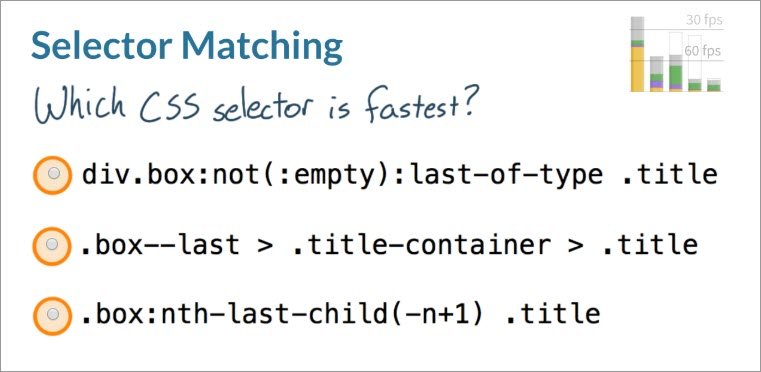
You’ve got these three options. And if you want to see them in action, check out this link here.
13.4 Solution
Remember the only way you can really know which one is fastest is by measuring.So that’s exactly what we do.

You can see the times pop up. The first one is about 3.7 milliseconds the second is 1.00, and the last is almost 3.7 milliseconds. The middle selector is the clear winner here. However, things get a little bit more interesting.
Using different nightly builds the times shift somewhat. This goes to show just how important it is to measure your performance, because, as times change, so do the numbers.
So, this means that, for the moment, the middle answer’s the fastest. But hey, that can change some day. Make sure that you use the tools at your disposal to keep measuring.
13.5 Quiz: Recalculate Styles
Feeling up for a challenge? Here’s a link to this site.
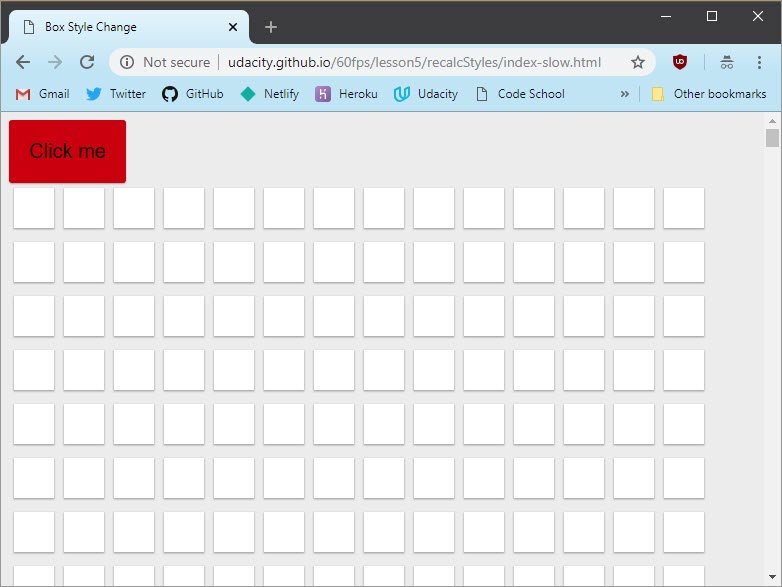
Pop open the timeline, hit the big red button to record. And then click the “Click Me” button. Find the big Recalculate Style block in the timeline, and then notice how it’s self time is going to be way too long to hit 60 frames per second.
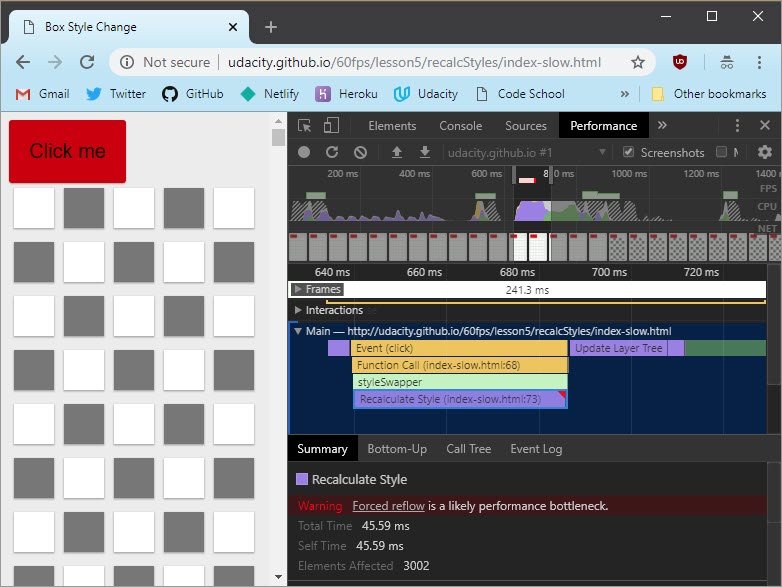
There are three things you can do in this case.
- You can either reduce the number of affected elements
- You can reduce the selector complexity
- or you can do both.
- Reducing the number of affected elements
- means modifying fewer nodes in the render tree.
- Reducing selector complexity
- means that you are going to using fewer tags and class names to select your elements.
But hey, why not try to do both, because that is a double whammy.
For this quiz, I want you to make recalculate styles much more efficient. If all goes well, you should be able to get a five to ten x drop. But before you start, I’m going to give you a little bit of a hint.
This sample uses a class on the body to change the style of all the boxes. And this means that it has to check the style of each and every box.
// javascript
button.addEventListener('click', function() {
  document.body.classList.toggle('toggled');
});
/* css */
body.toggled main .box-container .box:nth-child(2n) {
  background: #777 !important;
}
You can see that happening here with this nth-child selector on class .box. An alternative would be to use querySelectorAll to grab all of the boxes on the page.
Once you have them, toggle the style of every other box by iterating through this list using JavaScript.
Once you’re seeing a five to ten x drop, check this box to let us know you’re recalculating styles much more efficiently.
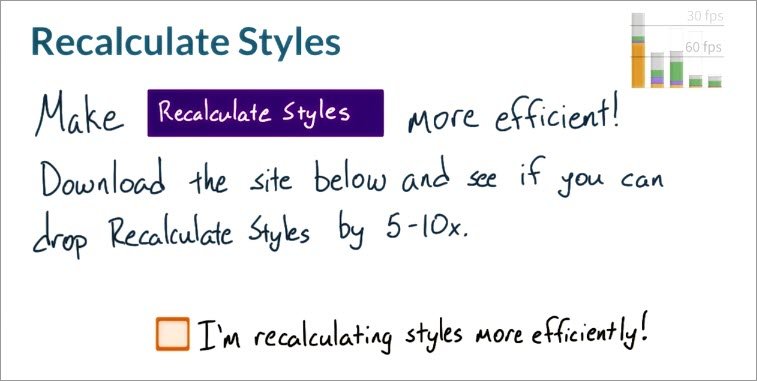
13.5 Solution
Here’s the solution that uses querySelectorAll.
First things first. I look for every element on the page with class .box, using querySelectorAll. And then I loop through each element and attach the class .gray to every other one.
// javascript
var container = document.querySelector('.box-container');

button.addEventListener('click', function() {
  var boxes = container.querySelectorAll('.box');
  for(var i=0; i < boxes.length; i++) {
    if(i%2 === 1) {
      boxes[i].classList.add('gray');
    }
  }
});
/* css */
.gray {
  background: #777 !important;
}
So now the selectors are pretty simple and all the iteration is happening with JavaScript.
I start by recording the performance times on the old page.
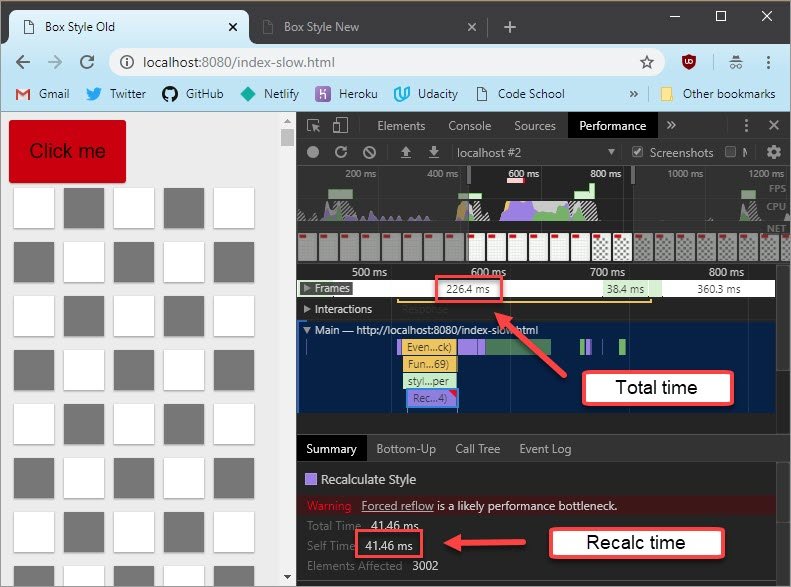
I then do the same for the new updated page.
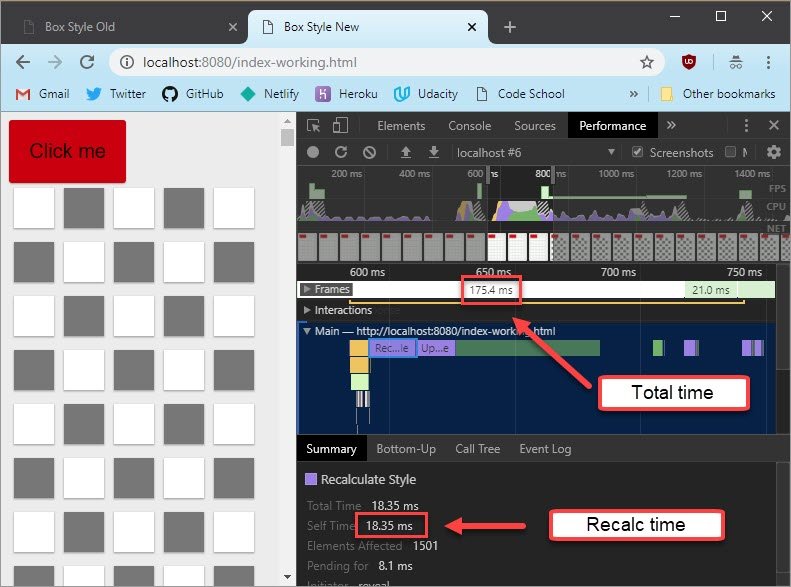
Here are the updated results.
| page | re-calc time | total time |
|---|---|---|
| old page | 41 ms | 226 ms |
| new page | 18 ms | 175 ms |
In this case, a little bit of JavaScript and a little bit less CSS went a long way.
13.6 Layout Thrashing
Let’s take a look at this sample site. When I change the width of the green bar and then click this button, all the paragraphs will change size.
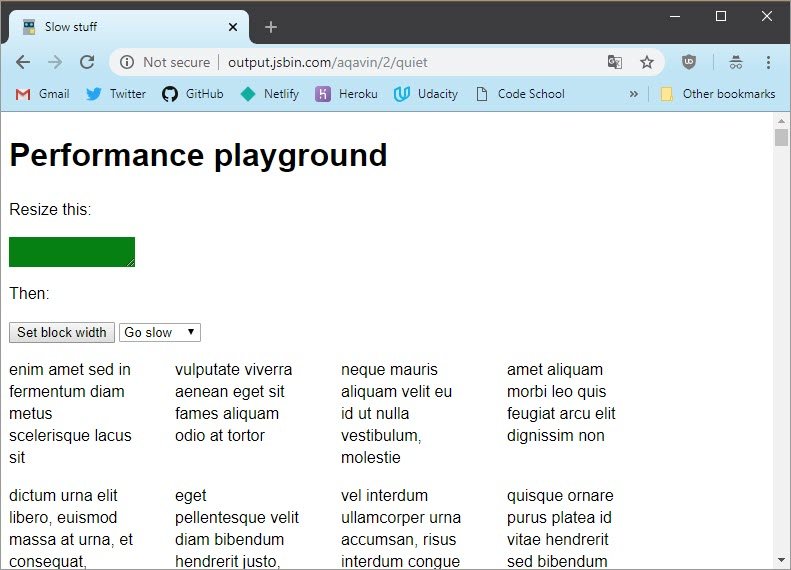
Unfortunately, it takes a really long time for that to work out. To understand why, we need to look again at the pipeline and specifically the order of the tasks that it contains.
The order is pretty clear.We do want JavaScript here.Then we do our style calculations and then we do any layout.
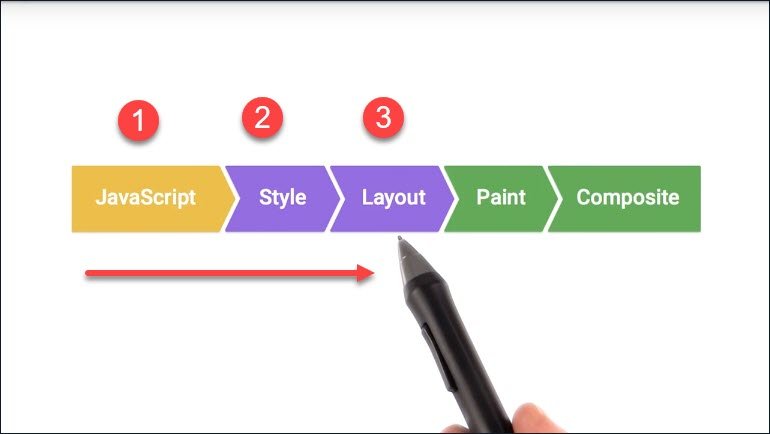
Maintaining this order is important. And this is the code.
var paragraphs = document.querySelector('p');
var greenBlock = document.getElementById('block');

for (var p =0; p < paragraphs.length; p++) {
  var blockWidth = greenBlock.offsetWidth;
  paragraphs[p].style.width = blockWidth + 'px';
}
First we select all the paragraphs, and then the green block. And then we step through each of the paragraphs in turn.
For each paragraph, we request the green block’s width,
var blockWidth = greenBlock.offsetWidth;
and then we set the width of each paragraph to match.
paragraphs[p].style.width = blockWidth + 'px';
Now the problem is this: to answer the question of the element’s width using offsetWidth, the browser must first calculate it, which requires layout.
But see what that does to the pipeline. It moves the layout task into JavaScript, and that puts the layout before the style calculations.

Now this is not a problem unless you now make a style change, which we did when we set the width of the paragraph.
Look again at the code. We request the width, and then we set a style. We do layout and then we do a style calculation.
var paragraphs = document.querySelector('p');
var greenBlock = document.getElementById('block');

for (var p =0; p < paragraphs.length; p++) {
  var blockWidth = greenBlock.offsetWidth;          // <- Layout
  paragraphs[p].style.width = blockWidth + 'px';    // <- Style
}
Every time we change a style, the layout pass that we just did is invalidated because you changed things. So now, the browser has to do it all again, and this can be an expensive mistake to make.
If you trigger a forced synchronous layout, DevTools will denote this with a little red triangle in the corner of a layout record.
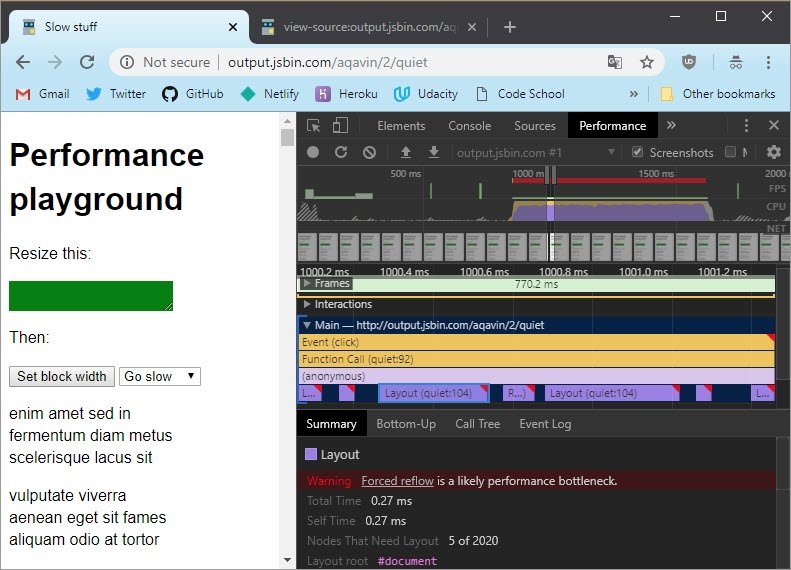
If you see this warning, then you need to look at where it was forced in your code and remove it.
13.7 Quiz: Forced Reflow
You just learned that forced synchronous layout (forced reflow) occurs when you ask a browser to run layout first inside the JavaScript section, and then recalculate styles, and then run layout again.
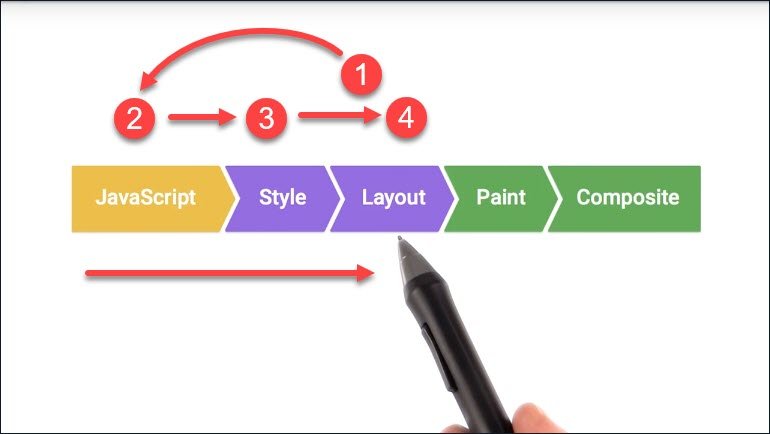
There are a few different properties that when accessed will cause layout. And you can find a list of them below.
With that in mind I’ve got three reasonable snippets of code I want you to analyze. Each includes some kind of iteration using forEach.
Normally you cannot use forEach with a collection of DOM nodes which is what you get from something like document.querySelectorAll.
But using the forEach callback syntax is pretty powerful. So what I do is convert the collection of DOM nodes, into an array of DOM nodes which gives you the option to use forEach and other array methods.
DOM Node Collection to Array
Here’s the helper function that I use instead of document.querySelectorAll.
function getDomNodeArray(selector) {
  // get the elements as a DOM collection
  var elemCollection = document.querySelectorAll(selector);

  // coerce the DOM collection into an array
  var elemArray = Array.prototype.slice.apply(elemCollection);

  return elemArray;
};

var divs = getDomNodeArray('div');
Anyways, two of these three will cause a Forced Reflow. But which one cannot cause a forced synchronous layout?
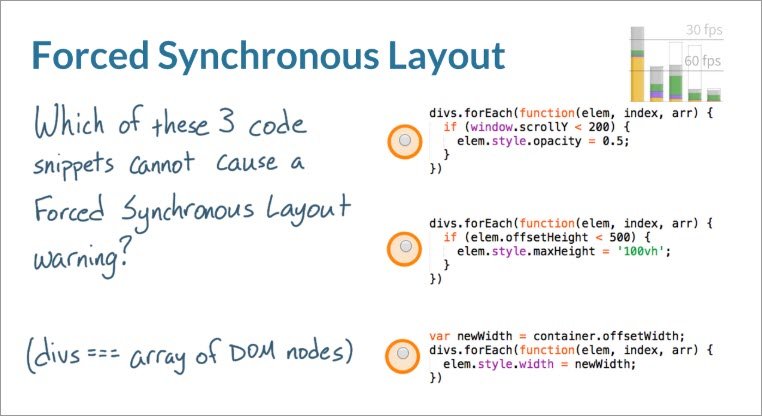
// Snippet #1
divs.forEach(function(elem, index, arr) {
  if (window.scrollY < 200) {
    elem.style.opacity = 0.5;
  }
})

// Snippet #2
divs.forEach(function(elem, index, arr) {
  if (elem.offsetHeight < 500) {
    elem.style.maxHeight = "100vh";
  }
})

// Snippet #3
var newWidth = container.offsetWidth;
divs.forEach(function(elem, index, arr) {
  elem.style.width = newWidth + "px";
})
Here’s a sample site that uses all three as well as some other helpful hints. So open the examples site, try out these three and see if you can figure out which one is not causing the forced synchronous layout.
13.7 Resources
- CSS Triggers - Which CSS triggers layout, paint, & composite
- How (not) to trigger a layout in WebKit
- Google Developers - Avoid Layout Thrashing
13.7 Solution
I’ll start with a first one, which in fact does cause a forced synchronous layout.
// Snippet #1
divs.forEach(function(elem, index, arr) {
  if (window.scrollY < 200) {
    elem.style.opacity = 0.5;
  }
})
Take a look here at window.scrollY. This is one of those properties that, when accessed, will cause layout. So, you’re causing layout and then you’re updating styles. This is putting the browser in a bad read/write cycle between recalculate styles and layout.
The second option also causes a forced synchronous layout.
// Snippet #2
divs.forEach(unction(elem, index, arr) {
  if (elem.offsetHeight < 500) {
    elem.style.maxHeight = "100vh";
  }
})
Once again, accessing offsetHeight causes the browser to run layout, and then here comes a style change. This option is definitely bad for performance.
This means that the third one does not cause a forced synchronous layout.
// Snippet #3
var newWidth = container.offsetWidth;
divs.forEach(function(elem, index, arr) {
  elem.style.width = newWidth + "px";
})
Notice our accessing offsetWidth is happening outside of the loop. That’s a good strategy. Layout runs once and then you batch update the styles afterwards.
13.8 Quiz: Stopping Reflow
So, now that you know that pieces of code like this one can cause forced synchronous layout, what can you reasonably do to avoid it?
divs.forEach(function(elem, index, arr) {
  if (elem.offsetHeight < 500) {
    elem.style.maxHeight = "100vh";
  }
})
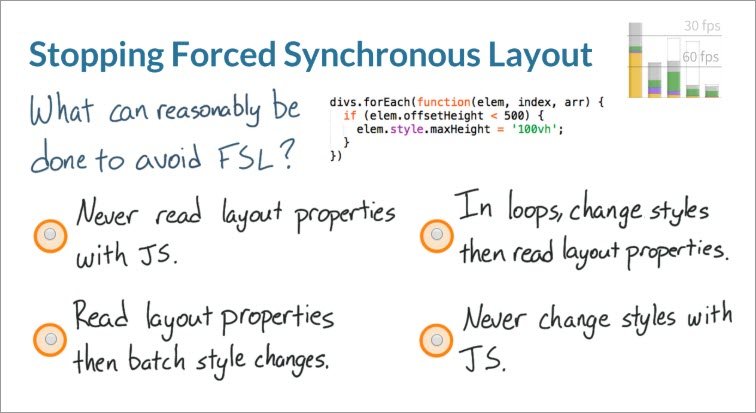
Pick one of these four answers.
13.8 Solution
First of all, answer #1 & #4 are definitely wrong. It’s totally reasonable to read and modify layout properties and styles with JavaScript. In fact, that’s why the language exists.So don’t be afraid of it,even though for synchronous layouts sometimes happen.
So I want to take a look the other two answers individually.
- In loops, you should always change your styles first and then read layout properties.
Now this answer sounds somewhat reasonable because you’re changing the styles first and then hitting the layout properties. The problem here is this keyword, “loops”.

Once you change the styles, you have to run layout. Okay, so if that happens once that’s not a big deal. But if before the end of the frame you have to recalculate styles and then run layout again, you’re putting the browser in a situation where it’s redoing a lot of work and ultimately creating a forced synchronous layout. So this answer is not correct.
So by the process of elimination, this answer’s right.
- Read layout properties then batch style changes.
Reading the layout properties first in the JavaScript phase means that you’ll be using the layout from the previous frame. Then if you do all of your style changes afterwards, right here in the pipeline, the rest of it looks like normal.
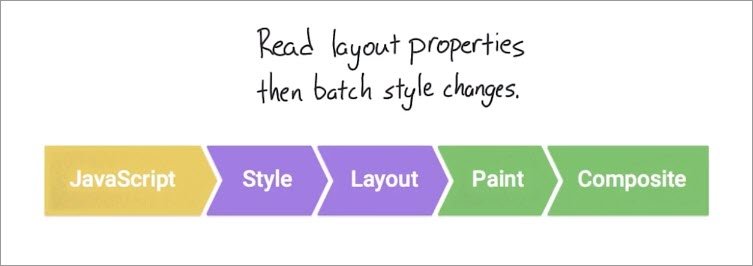
The keyword here is batch. And then all of the style changes will be batched up to happen after JavaScript. This means that recalculate style will happen at the end of the frame and in the right place for the pipeline.
So then, what does this strategy look like with the example you just saw?
This is the old janky code.
divs.forEach(function(elem, index, arr) {
  if (elem.offsetHeight < 500) {
    elem.style.maxHeight = "100vh";
  }
})
This is the 60 frames per second silky smooth code.
if (elem.offsetHeight < 500) {
  divs.forEach(function(elem, index, arr) {
    elem.style.maxHeight = "100vh";
  }
})
Notice that this frame only reads a layout property once at the beginning and then batch changes all of the styles afterwards. This is a pretty simple fix that will give you a big performance win.
13.9 Causes of Forced Reflow
In the last examples, I showed you that offsetWidth triggered the forced synchronous layout when interleaved with style changes. There are other properties that will cause similar issues when called at the wrong time.
Essentially it’s any property for which a browser must run layout. So anything to do with geometric information like positions and dimensions, that can cause a forced synchronous layout to happen.
And here’s something else about this example.
var paragraphs = document.querySelector('p');
var greenBlock = document.getElementById('block');

for (var p =0; p < paragraphs.length; p++) {
  var blockWidth = greenBlock.offsetWidth;          // <- Layout
  paragraphs[p].style.width = blockWidth + 'px';    // <- Style
}
Every single paragraph causes layout and then recalc style. This puts the browser into a cycle where you read and write a lot of values and we call this layout thrashing.
It’s where you do a forced synchronous layout, many times in quick succession. And you would not believe how many times I see this one out in the wild. For instance, check out this.
Let’s record. Change this slider. And then stop.
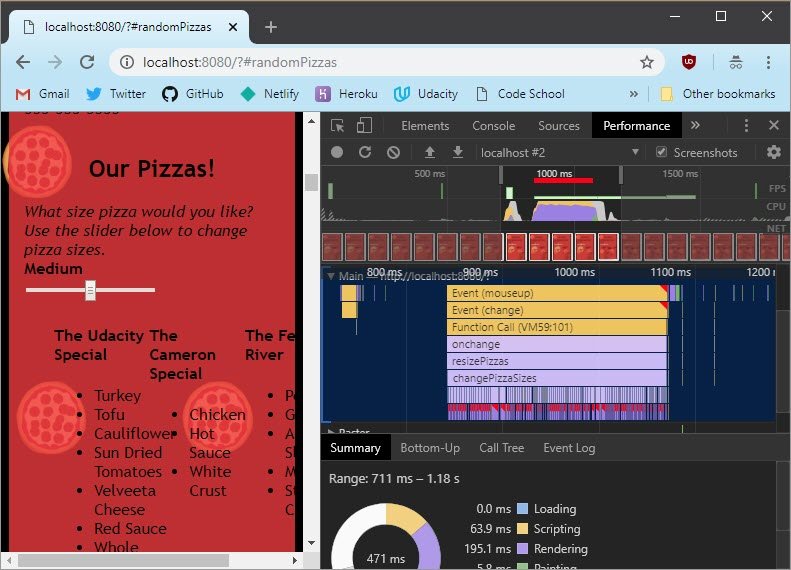
Let’s look in here. Pick any one of these, and we’ll zoom in a little bit more, And there we go. A forced synchronous layout there.
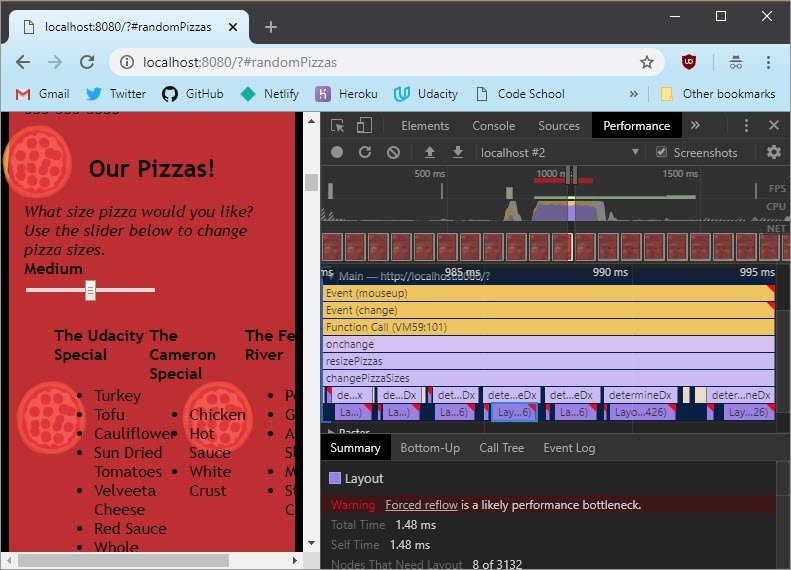
You can start to see here, all the individual forced synchronous layouts. Each one of these is going to make us run really slowly.
13.10 Quiz: Stop Forced Reflow
If you took website performance optimization, then this website may look a little familiar. Inside the project for the course, there’s this pizza site that has a lot of problems. And I think it’s fair to say that one of the problems with this website is that it will probably burn your eyes out, if you spend too much time looking at it.
When you scroll down to this our pizza section on the left side of the screen,you’ll notice this slider. When you toggle the sliders, the pizzas change size.
Now it doesn’t look so bad when you toggle back and forth between the different sizes, but I want to take a look at its performance.
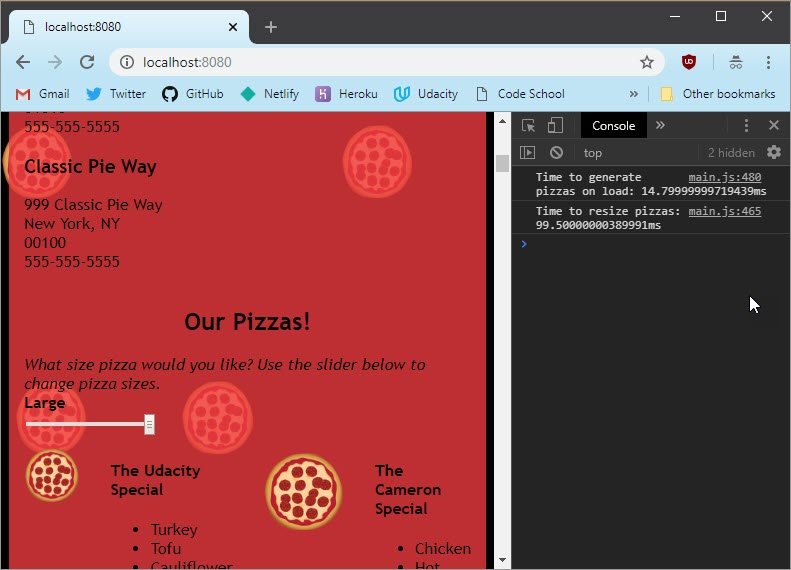
You’ll notice two things when you open up the console. The first is the average time to generate the last ten frames, which in this case is way too low for a site that’s a simple as this one. The second thing you’ll notice is the amount of time it took to resize the pizzas.
This number will be logged out anytime somebody clicks on the slider. Right now, it’s displaying times at around 100 milliseconds. A good question to ask is is 100 milliseconds reasonable for this?
In fact, this resize time falls under the response category of RAILs. And that’s because this is happening as a response to a user action, which includes clicking on the slider.
Resizing the pizzas falls under the response category of RAIL, which as you remember is 100 milliseconds. In that case, this app is actually meeting the budget for response. However, just given how simple this site is. There is no reason the resize pizza action should be taking 100 milliseconds.
Were this happening in the Animation or Idle phases, this would totally be blowing the frame budget.
I record a timeline to see if I can find out a little bit more about what’s happening with the slider.
This purple and red is a really bad sign. Let me expand this to take a closer look. It looks like the slider is calling a function and then the function is causing a ton of layouts one after another.
That is a major issue. I’ll click on one to get a little bit more information and in the details pane, I see that there’s a warning that says, “Forced reflow is a likely performance bottleneck”.
That is a problem. So for this quiz, it’s going to be your job to download the pizza site, find the cause of the sliders for synchronous layout and then fix it.
13.10 Solution
I’m going to show you how to fix one example of a Forced Reflow this page. You can see that when the slider changes a few different functions get called.
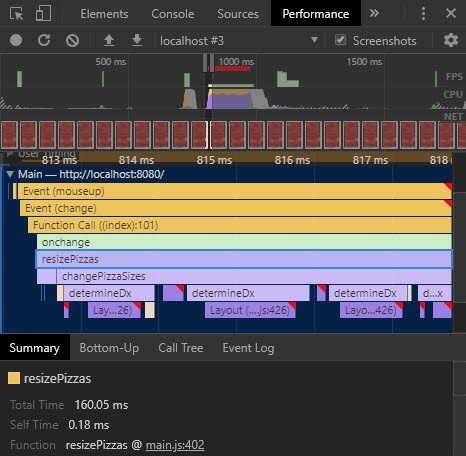
When the change event happens, resizePizzas gets called, then resizePizzas calls changePizzaSizes. And here’s where I think the problem might be coming in.It looks like some function called determineDx is running over and over.
I think this is a good point to take a look at the code. I gopast the resizePizzas function, which gets called when the slider gets activatedand drill down into the changePizzaSizes function.
// Iterates through pizza elements on the page and changes their widths
function changePizzaSizes(size) {
  for (var i = 0; i < document.querySelectorAll(".randomPizzaContainer").length; i++) {
    var dx = determineDx(document.querySelectorAll(".randomPizzaContainer")[i], size);
    var newwidth = (document.querySelectorAll(".randomPizzaContainer")[i].offsetWidth + dx) + 'px';
    document.querySelectorAll(".randomPizzaContainer")[i].style.width = newwidth;
  }
}

function determineDx (elem, size) {
  var oldwidth = elem.offsetWidth;
  var windowwidth = document.querySelector("#randomPizzas").offsetWidth;
  var oldsize = oldwidth / windowwidth;

  // Changes the slider value to a percent width
  function sizeSwitcher (size) {
    switch(size) {
      case "1":
        return 0.25;
      case "2":
        return 0.3333;
      case "3":
        return 0.5;
      default:
        console.log("bug in sizeSwitcher");
    }
  }

  var newsize = sizeSwitcher(size);
  var dx = (newsize - oldsize) * windowwidth;

  return dx;
}
Now this piece of code may look okay on the surface, but it is absolutely insane. And it’s insane in that it is doing way too much.
First off there’s the very obvious problem that this function doesn’t pass the do not repeat yourself test. Look document.querySelectorAll(".randomPizzaContainer") is in here three times.
So first is I save this collection to the variable randomPizzas. Now I can use randomPizzas in my for loop without querying the dom every time.
Now take a look at this for loop. It access is a geometric property of the elements, in this case offsetWidth and then changes their styles. So this is clearly the source of the forced reflow.
So then there’s this function, determineDX. Suffice it to say this function is remarkably useless. It’s complicated, it creates a lot of work, and it has no business being inside this for loop.
In the end I just combine it into our changePizzaSizes
// Iterates through pizza elements on the page and changes their widths
function changePizzaSizes(size) {
  var newWidth;
  switch(size) {
    case "1":
      newWidth = 25;
      break;
    case "2":
      newWidth = 33.3;
      break;
    case "3":
      newWidth = 50;
      break;
    default:
      console.log("bug in sizeSwitcher");
  }

  var randomPizzas = document.querySelectorAll(".randomPizzaContainer");

  for (var i = 0; i < randomPizzas.length; i++) {
    randomPizzas[i].style.width = newWidth + '%';
  }
}
In this version all changePizzaSizes does is simply figure out which width it wants and then sets the width for every element to that percentage. There is no more query selecting inside the for loop and there’s no more conversion back and forth between pixels and percentages.
This is a lot simpler but the ultimate test for this code is whether or not it produces forced reflows.
Here’s the new and improved version and first off let me just see if it’s giving me better numbers.
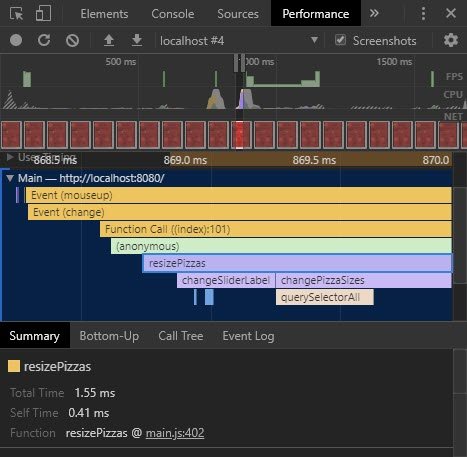
And look at that time to resizePizzas in under two millisecond vs. 160 milliseconds. This is clearly much more performant. Also no more ugly red triangle saying that there is a Forced reflow. This timeline is much cleaner.
13.11 Lesson Outro
Earlier, we discussed how you don’t always touch every part of the rendering pipeline. In fact, the workload depends very heavily on exactly which properties you change.
Often people ask me whether they should animate styles with JavaScript or CSS. Which one is faster? And honestly, it rarely matters. Most of the time the speed is the same. The reason is that changing, say, width incurs the cost of layout no matter how you do it. That’s true whether you did it in JavaScript or CSS.
If you change width, height, top, left, you’re going to trigger layout. If you trigger layout, you’re going to trigger paint. Or maybe you just change box-shadow on an element. That’s not going to trigger layout but it will trigger paint, and paint is super expensive, especially on a mobile device and you can’t trigger layout without triggering paint.
You need to be careful about what styles you change and when. In the app life cycle, which if you recall was RAIL, Response, Animation, Idle, and Load.
You can afford to do these expensive style changes in the Load, Idle, and Response times but not during Animations.
During animations you’ll want to avoid layout and paint if at all possible. Just because they’re normally too expensive to fit into the short time you have available.
Now if you can’t do that, you’re going to have to find a way of limiting your effects. Let’s get on to the next lesson, where we’ll discuss just that.
14. Compositing & Painting
14.1 Lesson Intro
As you learned back in the first lesson and as you rediscovered in the last lesson, not all style changes are equal.
- Some will trigger layout, paint and composite.
- Some will trigger paint and composite.
- And some will just trigger composite.
In this lesson you’ll learn how to optimize the last two stages of the pipeline. Painting and compositing.
If you want a full break down of how styles affect the rendering pipeline, check out Paul’s awesome website, csstriggers.com. So when you’re wondering if the thing that you want to animate is going to trigger a layout, paint, or composite, check out csstriggers.com because it’s got you covered.
All right, let’s see what we’ve got in our tool kit for getting our heads around painting. Paint is normally one of the fastest ways to kill your frames per second. And let’s face it, that’s exactly what we’re trying to avoid here.
14.2 Quiz: Paint Rectangles
Take a look at this parallax demo site. When you scroll up and down it looks okay but it actually could be a lot better.
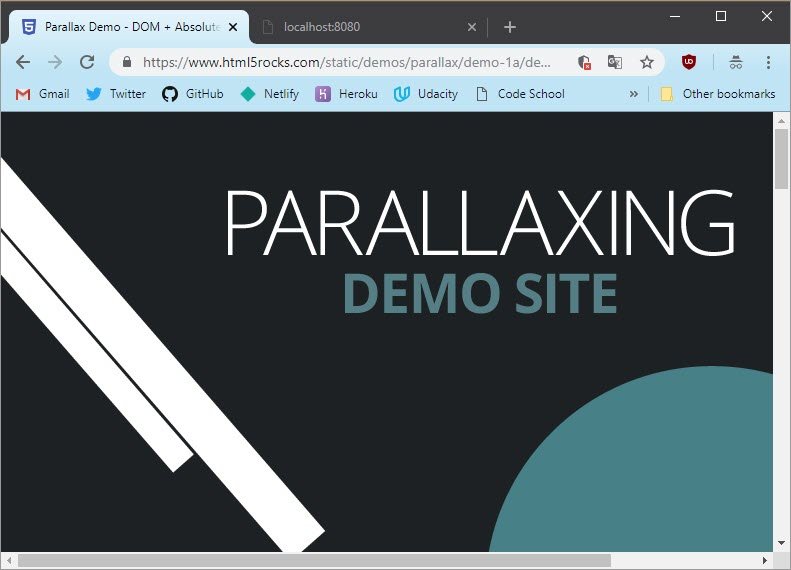
There’s quite a bit of painting happening here. Paint problems can be way worse than virtually any other performance bottleneck you’re likely to hit.
So I’m going to open dev tools to turn on Paint Flashing. Once you’re in dev tools click the menu (three dots) -> More tools -> Rendering. Rendering has some especially cool options which are going to be really useful and you’ll be exploring in this quiz and the next couple.
For this quiz you’re going to check Paint flashing. If you’re ever worried about painting, this is your go-to move to check out what’s happening. It’ll show you when and where painting is happening on the page.

You’re going to be looking at this site for the quiz, so I’m going to show you an example using my Twitter page.
When I scroll up and down, you can see that the scroll bar is showing up in green, and that means it’s being repainted. This video here is totally in green and that’s because every frame has to be painted.
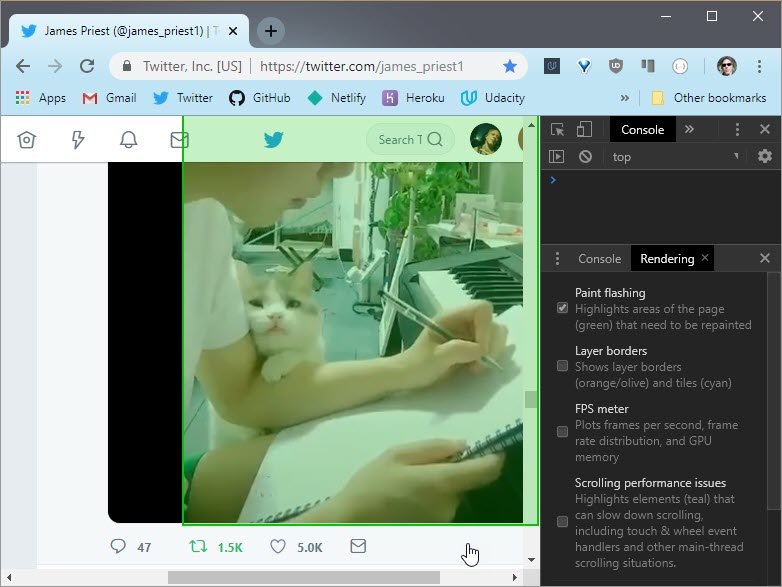
Look for the green flashes and you’ll see where painting is happening. So for this quiz, I want you to go back to the parallax site and click on Paint flashing.
Scroll around a bit, and try to figure out, where is the painting happening?
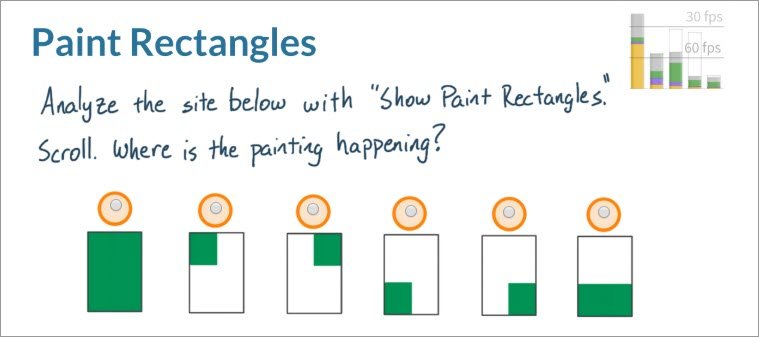
Pick one of these answers.
14.2 Solution
So I’ve got Show paint rectangles checked, and I will scroll. And it looks like the entire page is flashing green. So the correct answer is, the entire page is being painted.
So what’s going on here? What’s being painted and why is it being painted? Let’s find out.
14.3 Quiz: Paint Profiler
So if you hit an unexpected paint like you just saw, you’ve got another tool at your disposal, and it is called the Paint Profiler (Advanced paint instrumentation).
You can find it in the Performance tab.
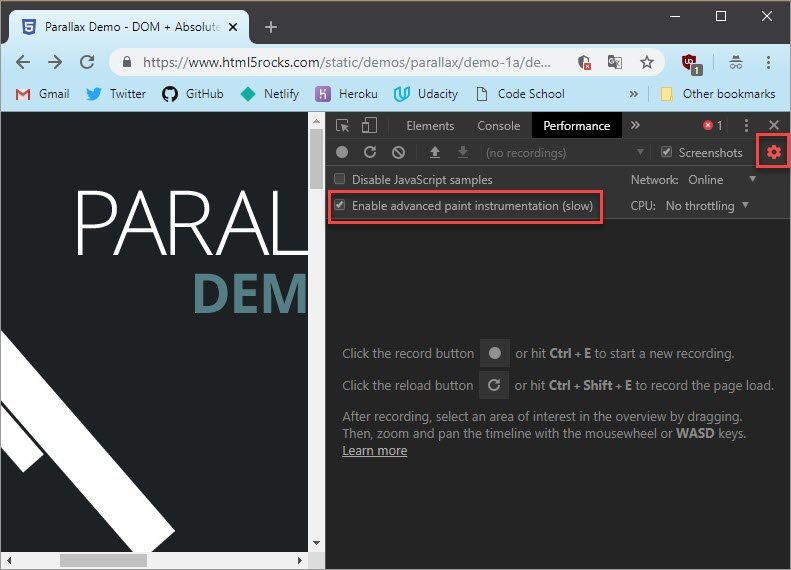
The Paint Profiler makes it really easy to identify what areas of the page are being painted and when they’re being painted.
For this quiz, go back to the scene you were on and turn on the Paint Profiler. Hit the record button, and scroll up and down.You should see a bunch of long-running paint records. Click on one of the paints, and then check out what you find.
14.3 Solution
I’ve clicked on one of the paint records, and now I’ve got the Paint Profiler. Inside the Paint Profiler there are a few things to pay attention to.
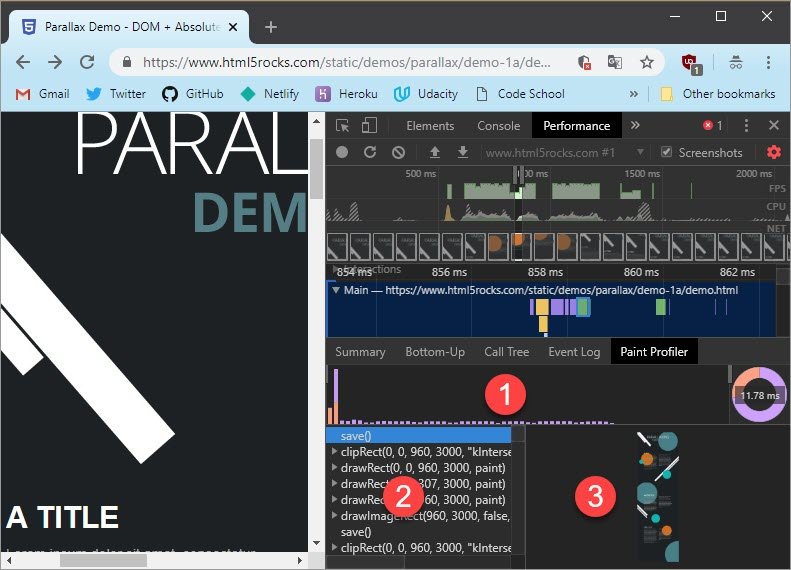
- There is a whole new timeline here.
- There is a list of paint commands.
- There is the part of the page that was painted.
Notice that, right now, this timeline is the entire paint command, and you see that it’s the entire page that got painted. But if you limit the timeline to just a small part, you’ll see what was painted then.
This is a fantastic tool to see exactly what the browser is painting at different points .Here I’ve gone to the beginning of the paint, and you can see where a few lines and circles is being painted.
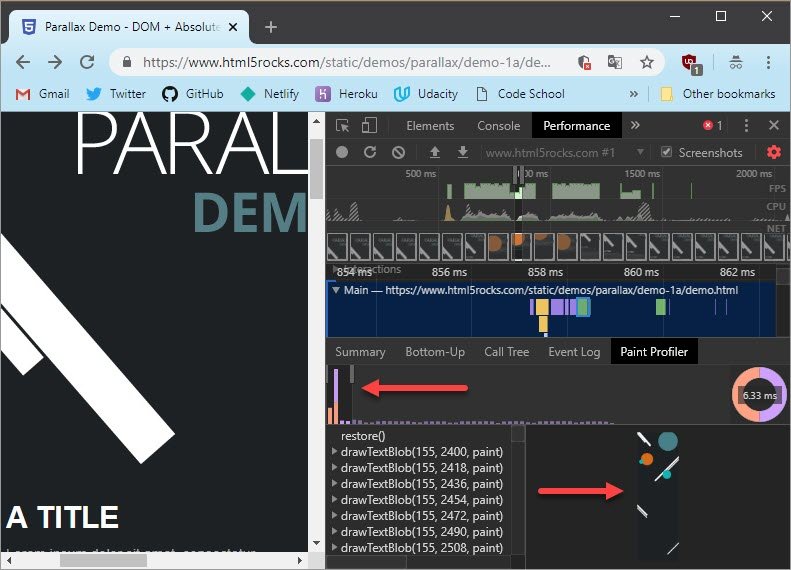
Here on the side you can see the drawTextBlob commands. Going back to the whole timeline for the paint,you can see the first one is save, and that is the answer to this question.
I want to point out one last thing, and that is that all of these paint commands, these green bars here, are really close to the 60 fps line.
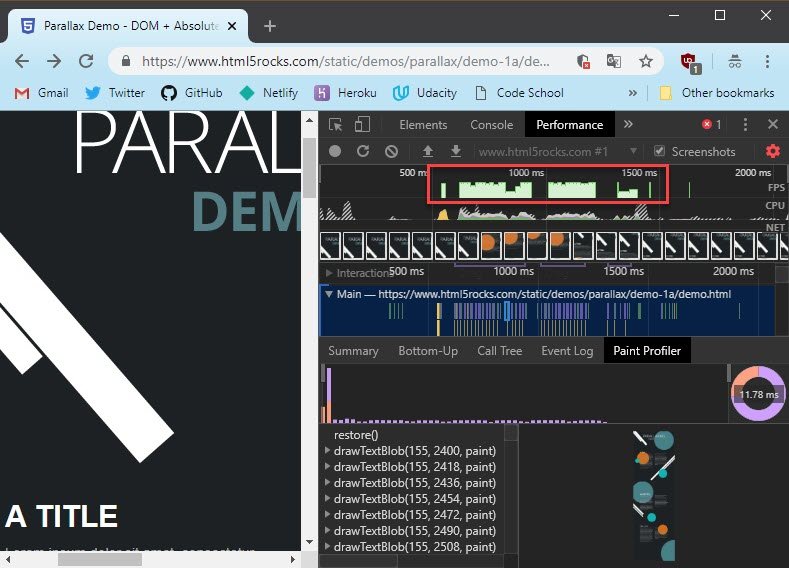
So right now it’s running at 60 fps, but it’s extremely close to the budget, and if there are any other work going on, chances are you won’t be hitting 60 frames per second.
So let’s see what you can do about it. But first, the correct answer is save().
14.4 Compositing
Okay, let’s talk about compositing a little bit more. Now I’ve got a page here, and what I want to do is bring out a side nav.

So what I normally do is I have one layer in memory, and I just redrawthe pixels for the side nav, and I do that for every frame of animation. So in the end we have one layer here with the side nav drawn and the page content behind it.

Now, the problem with that is that on every frame, I’ve been painting.
Instead, what we can do is a better version of this, where we have one layer with the page content in, another layer with the side nav in.

All we then need to do is slide the side nav over the top of the page, and we get the same effect, but without painting.
14.5 Quiz: Conceptual Question
Layers are a common concept in image manipulation software. For instance, at Udacity we use a piece of software called SketchBook Pro to make drawings like the ones you see here.

And we use layers to make it easy to separate and edit different parts of our drawings. Here let me show you. These are the menu options I get when I’m using SketchBook. And this one here gives me control over the layers.
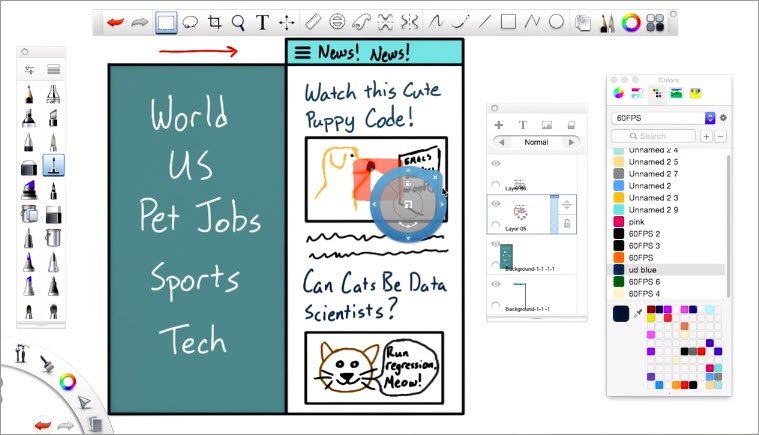
For instance, I can hide the background. I can hide the sidebar for the stories. I can select this story, and I can move it around the page without affecting any of the other layers which is pretty cool.
Being able to control separate parts of this image individually makes it much easier to put together something complex. Photoshop uses layers too, as does pretty much every other piece of visual media creation software.
Our video production team, for example, uses Adobe Premier to composite all the videos that you watch on Udacity. In fact, these tablet style videos have two main layers. We create one layer by doing a screen recording on the tablet. And then we create a second layer with a camera above the tablet pointed down at our hands. When the two are composited it together, we put the tablet on top of the hand so that no matter where the hand is on the screen, you can always read the text. Pretty cool.
For this quiz, I want you to think about the layers of this mobile app. The menu, which is currently shown on the side of the page, will slide in when somebody clicks on the hamburger icon. The nav bar at the top is going to be stuck at the top, so if the user scrolls up and down, it’s not going to move. And then the stories can obviously slide up and and down.
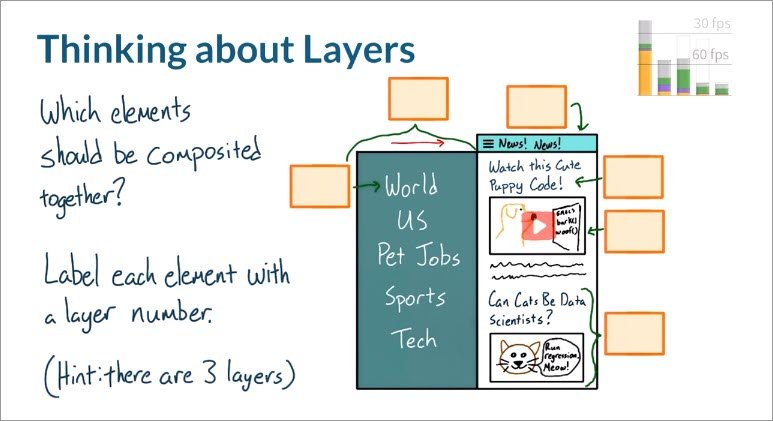
So, knowing what you know about how elements that stick and move together should be in the same layer, how would you organize the layers in this app? For elements that you want to be on the same layer, give them the same number. And then one last hint, there should be a total of three layers when you composite this page.
14.5 Solution
I’ll start on the left with world in the entire hamburger icon menu. I’ve put these two on the same layer because they’ll be sticking together as it slides into the page.
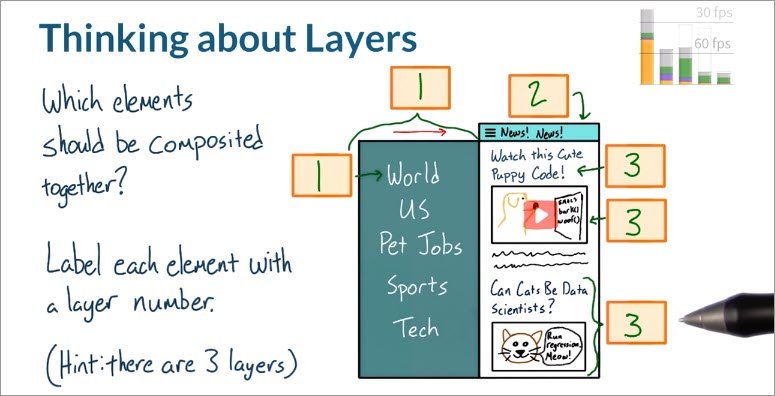
Next up the top nav is static and doesn’t move with anything soit should be its own layer.And lastly I’ve put all the articles on the same layer.Which makes sense because they stick together as a user scrolls up and down.
14.6 Composite Layers
In Chrome Dev Tools, there are two records that you might see relating to layers or composite to layers.

The first one is Update Layer Tree, which happens when Chrome’s internal engine, called Blink, figures out what layers are needed for the page. It looks at the styles of the elements and tries to figure out what order everything should be in and how many layers it needs.
Composite Layers is the other record where the browser is now putting the page together to send to the screen. The more layers you have, the more time will be spent in layer management and compositing.
So there’s a tradeoff between reducing paint time, and increasing layer management time.
14.7 Managing Layers
So you might think that layers are a totally automated process, and that’s mostly true. Generally speaking, you should let the browser manage layers because it knows what it’s doing.
But if you’re hitting a paint issue, then you might want to think about promoting an element to its own layer. You may be wondering, how do I create a layer? Well, before I get to that, you should see if an element already has its own layer.
14.8 Managing Layers 2
So back in dev tools one of the things you can do is bring up the Rendering tool by clicking the menu (three vertical dots) -> More tools -> Rendering.
What I’m going to do is switch on Layer borders (Show Composited Layer Borders). When it’s switched on, the page will show you a grid.
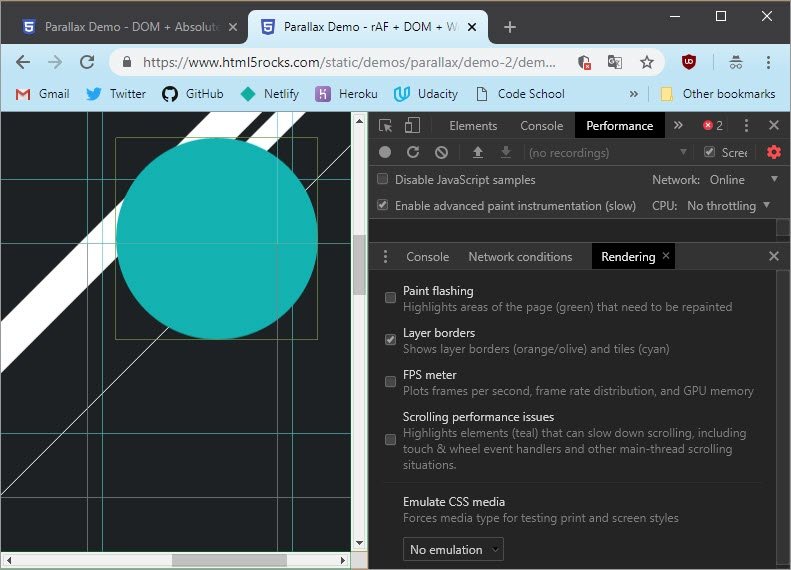
These light blue lines represent the tiles that each layer is split into. But as developers, there’s nothing we can do about that. It’s just how the browser chose to split up the layer.
But the interesting ones are these orange boxes here, which you can see around the circles and heading. These orange boxes are elements that are on their own composited layer.
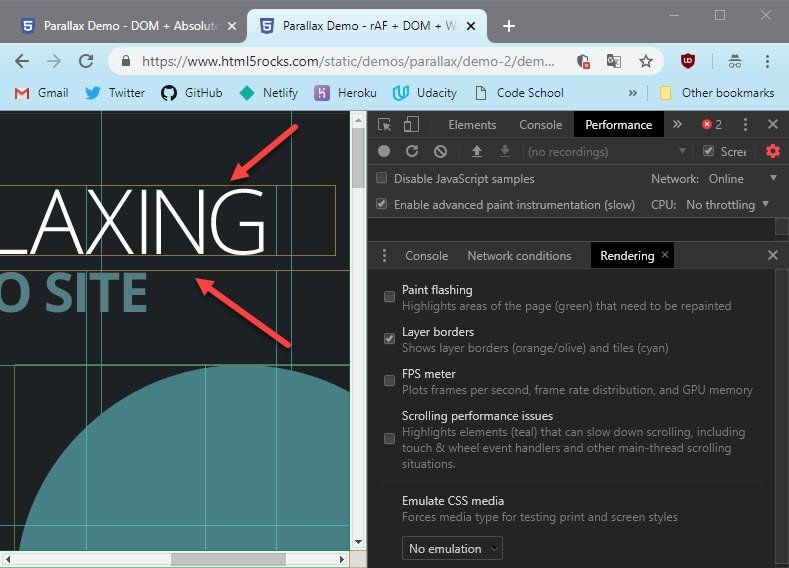
So how, then, do we make one of these layers? Seems like it might be pretty useful. Well, there are ways that virtually every browser uses and some are hackier than others.
Let’s start with a newer, not hacky way.

In Chrome and Firefox you can use the will-change CSS property to tell the browser to expect visual changes. It can then choose to put the element on a new compositor layer. In this case we have, will-change: transform, and that tells the browser that we intend to change the elements transform at some point. And so to prepare for that, it creates a new layer.
Instead of transform, you could also put left, top, width, or height,or any visual property. But even if the browser’s expecting those changes, it would still have to run layouts and paint for them. So the forewarning that you plan to change them won’t actually yield much improvement.
The benefit of will-change: transform comes because creating new layers can be expensive since they need to be created and then painted. And doing that on the fly can be expensive. For older browsers, and Safari,you’ll need to use something like a 3D transform.
.circle {
  transform: translateZ(0);
}
In fact, a transform of translateZ(0) is the most common form of this hack. It’s called the no transform hack by most people. And it applies a 3D transform, pushing the element in Z space by absolutely nothing.
It’s enough though to persuade the browser to create a layer. In a production environment, you’ll probably need both transform: translateZ(0), and will-change: transform.
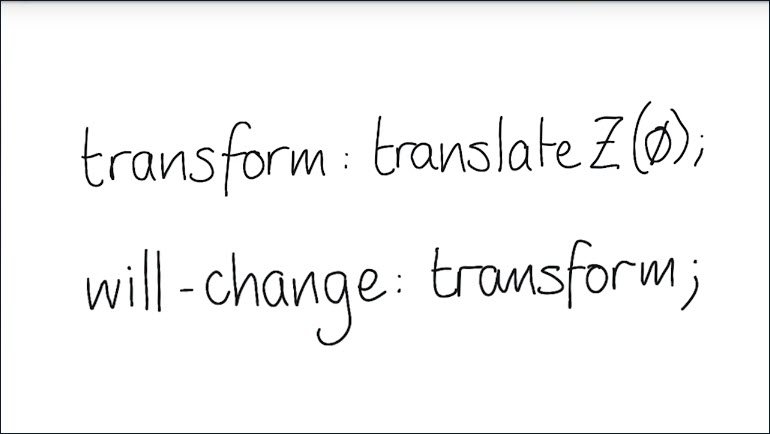
You shouldn’t use hacks unnecessarily. But today, not all browsers support will-change, so you may well need to. The null transform hack forces the browsers hand. But will-change is a hint that the browser can ignore, and that gives the browser more options.
It’s better to let the browser decide what to do where you can. With will-change of giving it the hint, but letting it decide what to do with it.
14.9 Quiz: Will-Change
Remember this crazy site?
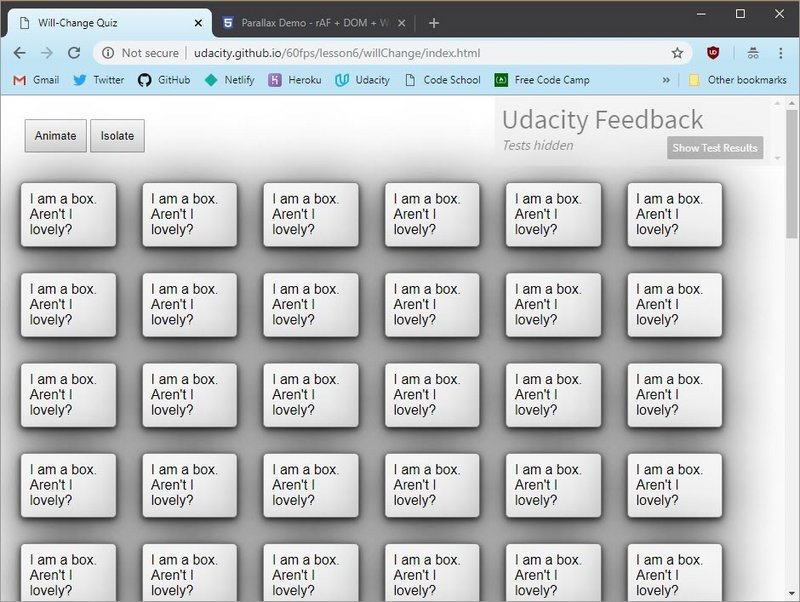
For this quiz, you’re going to be improving its performance a little bit.
I’ve hit the Animate button to start the spiral. In dev tools, I’ve hit the Paint flashing (Show paint rectangles) checkbox and you can see that the entire page is flashing green for every frame.
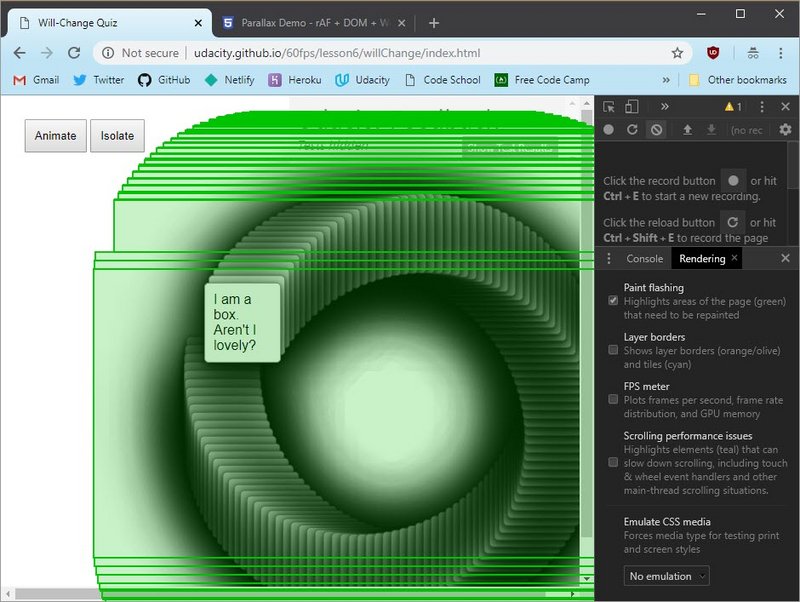
What you’re seeing here is really inefficient, so for this quiz promote the box class elements using will-change: transform so that they get isolated to their own layers.
You could also hit the transform button back on the site, which uses a 3D transform.
And once you’ve used will-change transform to let the browser know that the box elements are going to be changing, you’ll see a code appear on the screen.
Type that code into this box to continue.
14.9 Solution
Here is a recording of the animation without will-change: transform css property set. It has a performance of about 10 frames per second.
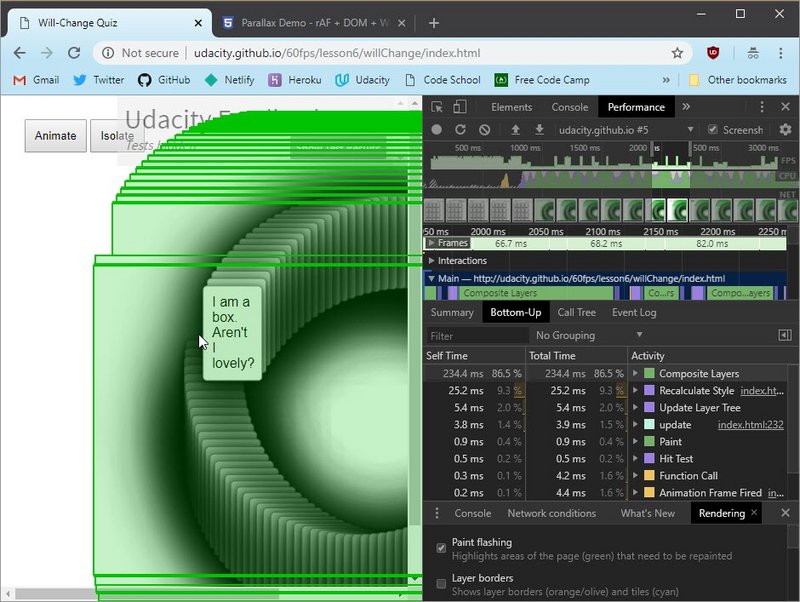
Now, inside the box class I’ve added the CSS property will-change: transform and immediately there is a huge performance boost.

That looks pretty close to 60 frames per second.
Promoting elements to layers can be super awesome for avoiding paint problems. Especially those related to movement or opacity changes.
If you change a visual property though, like say for instance, text color or shadows, promoting an element won’t help in any way, because you’ll still have to paint it. So make sure you’re only using layer promotion when it makes sense.
14.10 Compositing Budget
So you should promote everything, right? No. Like I said earlier, layer management and compositing are not free and so this is a balancing act.
There’s no magic number of layers that you should aim for but you are shooting for no more than two milliseconds in update layer tree and two milliseconds in compositing, for 60 frames a second critical work like animations.
Of course, if you’re still going over that by hitting 60 frames per second, that’s not bad.The key is knowing about the tradeoffs and then finding the right numbers for your own project.
14.11 Quiz: Layer Counting
Did you know that you can find out how many layers you’ve got in a website?
Of course for this, it’s once again time to head over into Chrome dev tools. I’m looking at the parallax demo and I’ve already added will-changed: transform to all the blobs. I’ve also “Enabled advanced paint instrumentation” in the Performance panel.
I’ve opened DevTools in a separate window to get a little bit more space. Notice how each frame has a green bar or box in the frames layer. You now have the ability to see all the layers on the screen.

At the top, you’ve got a few looking around and rotating tools. For instance, I can now rotate the page to get a 3D view of all the layers.
14.11 Layers tool
The Layers tool has gotten it’s own menu item outside of the Performance panel with additional information. This is where you go in order to see the Compositing Reasons and get better naming in the layer tree.
You open the Layers tool by clicking the menu (three vertical dots) -> More tools -> Layers.
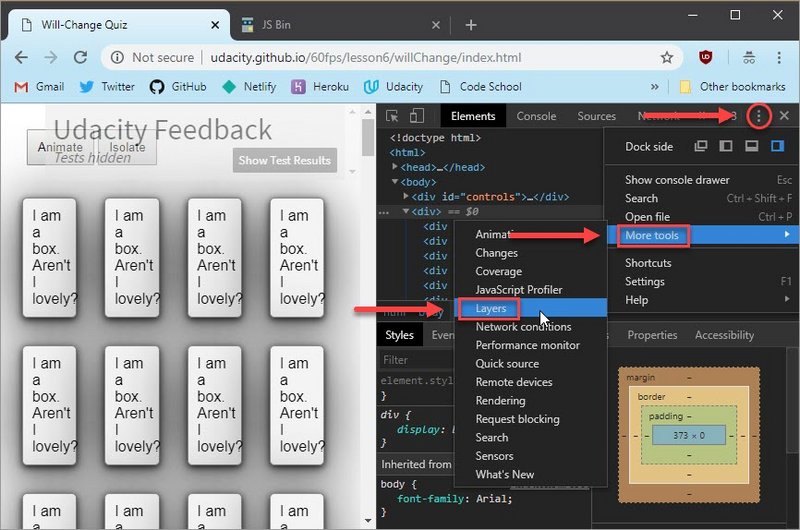
Now in the layers menu you can expand everything under #document in order to view all layers.
You also have some looking around and rotating tools which let you move and rotate to get a 3D view.
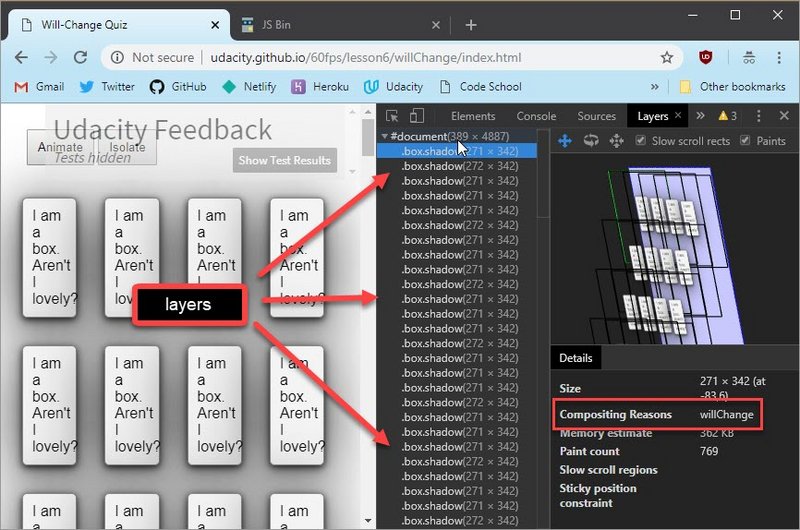
Here’s the same layer view after I hit the Animate button. This shows each layer in it’s own z plane.
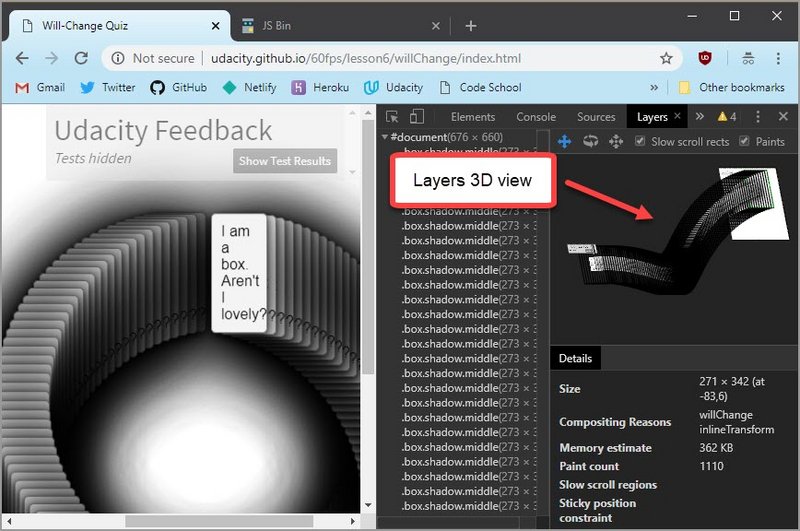
Now it’s your turn to try counting layers. Head to this site
Open Up the Layer tool and answer the following questions.
- how many layers are there (besides
#document) - Why was #totes-promoted promoted?
- will-change
- overlap w/ composited content
- 3D transform
- accelerated canvas
- animates a transform
14.11 Solution
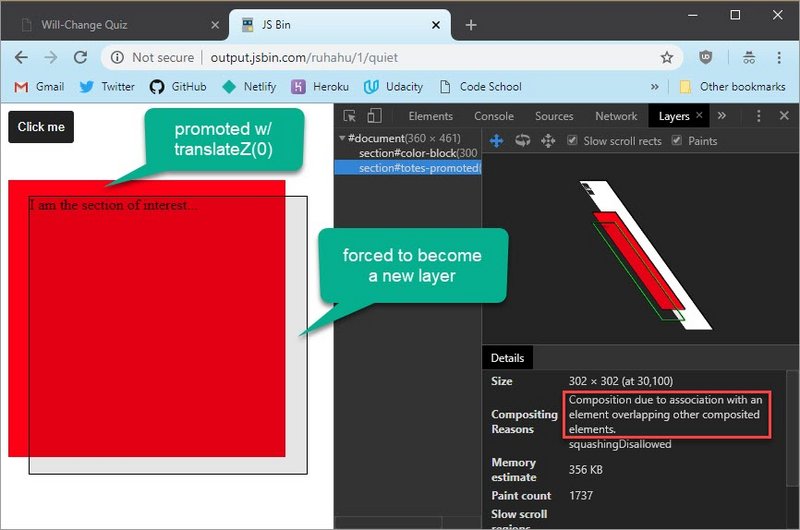
I’ll click on tote’s promoted and I can see that this layer was composited, because it overlaps with other composited content. In this case the other content is the color block section behind it.
Looking in the layers panel, you can see that underneath the root document there are two layers on the page. Looking at the source for the page you can see that the color block element has a translateZ transform applied to it.
#color-block {
  transform: translateZ(0);
}
This means it’s promoted to its own layer. In order to maintain the draw order, the section in the text with it must also now have its own layer and be placed on top of the color block.
If you promote an element to a layer, you need to be careful because you could accidentally create a lot of other layers with it due to overlap. So anyways, there you have it.
The main thing is to try to balance the compositing time in layer management with time that you spend in other parts of the pipeline. Applying will-change: transform or translateZ(0) to all of your elements might seem appealing, but it’s going to send your memory usage and compositing time through the roof.
In the end, you might cause more problems than you solve which is especially a problem on mobile.
14.12 Quiz: Paint & Composite
So I’ve opened up the Parallax demo from before. And I’ve got DevTools open. I’ll click on show paint rectangles and now I will scroll. And you can see that the entire page is lighting up in green.Which means that there is a lot of painting happening. There must be a problem with this demo.
To understand why there’s a lot of painting happening, I’ve opened up the source code for for the Parallaxing site CSS. You can see that there are a lot of elements that have will-change: transform applied to them, but it must not be everything. Something Parallaxing has not been promoted using will-change transform.
So for this quiz I want you to find the element that should have been promoted with will-change. Use DevTools to fix it and then to finish this quiz simply type its ID into this box right here.

14.13 Make Some Quizzes
In a few moments, you are going to be introduced to the requirements for the final project of the course. But, before I get to that, I want to talk about quizzes. You’ve probably noticed that we like to put a lot of quizzes in our courses because that’s just how people learn. You’re taking this course because you want to make your apps faster. So it makes sense for us to give you a lot of sites to analyze and dejankify as you go through the course.
But of course, not every quiz involves you debugging apps. We also like to pepper in quizzes that we hope will give you a better conceptual understanding of what you’re trying to accomplish.
14.14 Quiz: Final Project
You are looking at the final project. Congratulations on making it this far. You’re going to need a copy of this project on your local machine.
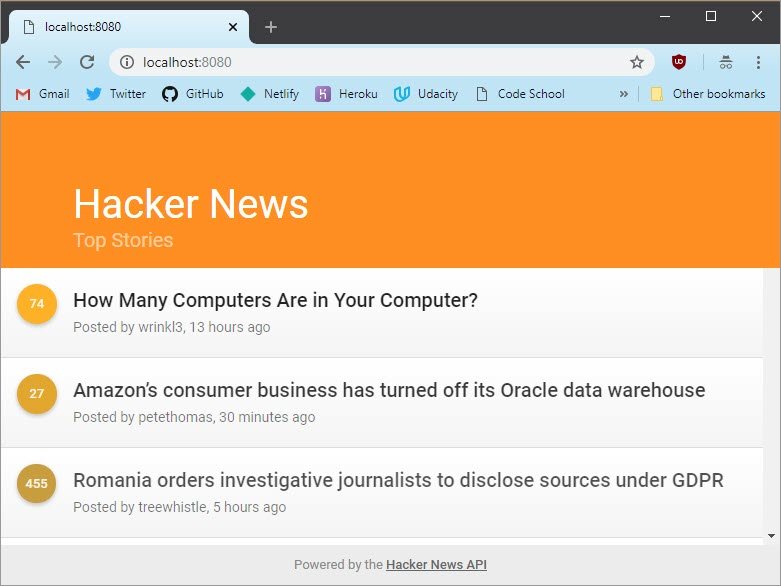
In this app, Paul has created a performance nightmare. This news aggregator uses the Hacker News API to pull up the current top stories. It’s pretty cool, but watch the frame rate right here as I scroll. That definitely didn’t look good. Now watch what happens when stories slide in and out. See how it drops? And just try using this app on mobile. It is totally unusable. There’s going to be a lot to improve.
Here’s a link to a list of hints for major areas that definitely need fixing. But if you want a real performance challenge, don’t look. Take some measurements and see what you can find out on your own.Try it yourself first, and then use the hints as a fallback.
In the solution video, you’ll see me go over a few of the high level problems that this app faces. And I’ll also show you how I fixed those. Keep in mind though, that my solution is just one of many. It is extremely likely that your code will look very, very different than mine. I’ll also post a link to my code, which you’ll be able to peruse and compare to your own. And for the completionists among you, I will also be posting a list of all the known bugs in the project.
If you’ve made it this far, you’ve got all of the tools that you need to make this app run at 60 frames per second. So what are you waiting for? Download the app, start measuring and start improving! When you are hitting 60 frames per second, post a link to the live version of your Performant app in the forums so that we can see what improvements you’ve made. Good luck everybody!
14.14 Solution
So here are a few of the high level problems that I fixed. Even without opening DevTools, it’s pretty obvious that this slide in and slide out motion is a little janky. You’ll also notice that scrolling is janky. As these are the two major interactions that users will have with this app, I’ll show you how I fix them.
First off, I’m going to tackle the janky scrolling. So what’s going on here? As I scroll down and then back up, you can see that the little indicators indicating how many points each story has not only changed size, but also changed color.
I want to see what that looks like in DevTools. I will start a recording, scroll a little bit, and then stop recording. In the timeline, it’s pretty obvious that I’m not hitting 60 frames per second because here’s the 30 frames per second line. I’ll zoom into one of these frames.
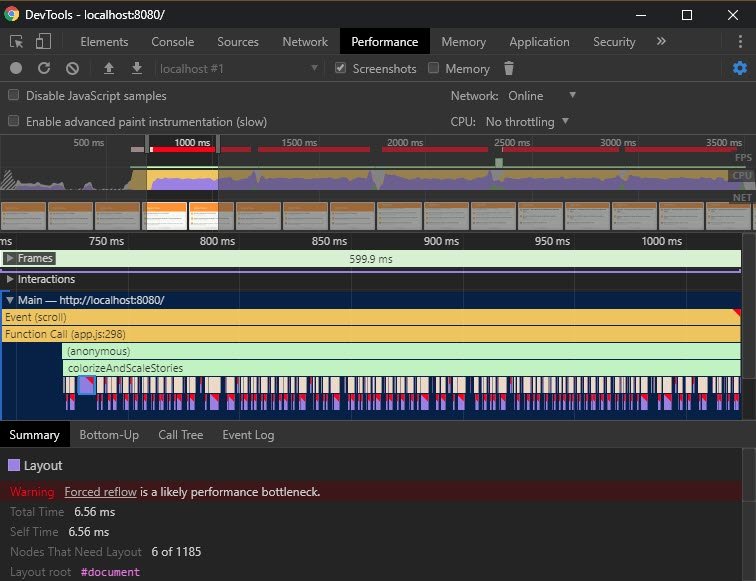
You can see that after the scroll event a function was called. And then you’ve got a lot of layouts with a lot of red triangles. That is an excellent sign that a forced synchronous layout is happening. Sure enough, there is the warning that forced synchronous layout is happening,and it looks like it is happening inside the function called colorizedAndScaleStories.
I jump into the source code and see what this function’s doing. In the source code, I’m now looking at colorizedAndScaleStories. And from the comments, it seems like this is probably a source of jank. So, thank you Paul for leaving these behind. Take a look at this part of the function, notice that a lot of properties that cause the browser to run layout are being accessed.
/**
 * Does this really add anything? Can we do this kind
 * of work in a cheaper way?
 */
function colorizeAndScaleStories() {

  var storyElements = document.querySelectorAll('.story');

  // It does seem awfully broad to change all the
  // colors every time!
  for (var s = 0; s < storyElements.length; s++) {

    var story = storyElements[s];
    var score = story.querySelector('.story__score');
    var title = story.querySelector('.story__title');

    // Base the scale on the y position of the score.
    var height = main.offsetHeight;
    var mainPosition = main.getBoundingClientRect();
    var scoreLocation = score.getBoundingClientRect().top -
        document.body.getBoundingClientRect().top;
    var scale = Math.min(1, 1 - (0.05 * ((scoreLocation - 170) / height)));
    var opacity = Math.min(1, 1 - (0.5 * ((scoreLocation - 170) / height)));

    score.style.width = (scale * 40) + 'px';
    score.style.height = (scale * 40) + 'px';
    score.style.lineHeight = (scale * 40) + 'px';

    // Now figure out how wide it is and use that to saturate it.
    scoreLocation = score.getBoundingClientRect();
    var saturation = (100 * ((scoreLocation.width - 38) / 2));

    score.style.backgroundColor = 'hsl(42, ' + saturation + '%, 50%)';
    title.style.opacity = opacity;
  }
}
Then at the bottom of the function, recalculate styles has to happen because there’s a new style applied. These two combined are causing the force synchronous layout. And it’s a huge problem for performance. Now this begs the very interesting question is this code even worth fixing? The effect is, well, pretty much negligible.
Having story points that are different sizes and different colors doesn’t really add anything to the app as a whole. For instance, are the one’s higher up more important than the one’s lower down? I don’t really think so. Ideally, this is the kind of effect you couldn’t possibly achieve with CSS properties like scale and transform instead of using JavaScript. But I, to be perfectly honest, think it is totally unnecessary.So, I’m just going to drop it all together.
Here’s the result. I got rid of all the calls to colorize and scale stories, and you’ll notice that now all of the points here look the same. But more importantly, what effect does this have on performance? Let me show you.I’ll hit record and then start scrolling. Now look at that! This is much nicer. I see the scroll event and there is only one recalculated style afterwards. No big deal, this is much more performant.
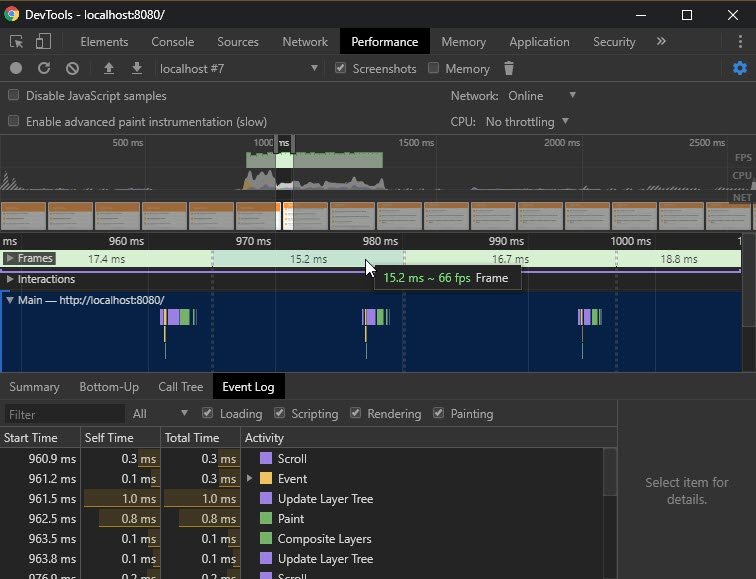
Next up, there are a few other scrolling bugs. I’m looking at loadStoryBatch. It does visible work to the page where it appends a new story to the page as it’s loaded. But it’s not inside a request animation frame. Ideally, anything that is making a visible change to the page, should be happening inside a request animation frame.
function loadStoryBatch() {
  if (storyLoadCount > 0)
    return;

  storyLoadCount = count;

  var end = storyStart + count;
  for (var i = storyStart; i < end; i++) {
    if (i >= stories.length)
      return;

    var key = String(stories[i]);
    var story = document.createElement('div');
    story.setAttribute('id', 's-' + key);
    story.classList.add('story');
    story.innerHTML = storyTemplate({
      title: '...',
      score: '-',
      by: '...',
      time: 0
    });
    main.appendChild(story);

    APP.Data.getStoryById(stories[i], onStoryData.bind(this, key));
  }

  storyStart += count;
}
So, I’ve gone ahead and added requestAnimationFrame to the call for loadStoryBatch, and that’ll be a nice little performance boost.
if (main.scrollTop > loadThreshold)
      requestAnimationFrame(loadStoryBatch());
Now, I will take on the stories that slide in, and then slide out. You’ll notice that the frame rate actually doesn’t look awful on this computer. But on my phone, it’s pretty much unusable. And actually, on my laptop, these bars looked a lot worse. So, it’s worth tackling.
It looks like the slide in, slide out motion is firing a timer, which doesn’t quite look right. And you’ll also notice that there’s a force synchronous layout down here. All in all, it’s worth investigating what’s going on here. Looks like line 180 in app.js is being called. So, I’ll click on that. And I can see that a function called animate is happening. I’ll take a deeper look inside the source code. I’m inside animate now and first thing I notice is that there’s a set timeout. Just like before, this is visible work that’s happening outside a request animation frame. So that’s an obvious fix. But then the real question is,should this work even be happening with JavaScript? It’s a simple transition that could just as easily be handled with CSS. Using some nice transforms and will-changes, it shouldn’t be too difficult for the browser.
And take a look at this.Inside onStoryClick, a new storyDetails, which is a thing that slides in gets appended to the body every time somebody clicks on a story. Given the fact that only one story will ever be shown at a time, this is incredibly wasteful. After a few clicks, the DOM is going to be filled with a bunch of abandoned nodes that are doing nothing but taking up memory. So, I wound up refactoring onStoryClick to simply change the innerHTML of the story details page instead of creating a brand new one for every story. That’ll prevent performance from dropping in the long run, but it doesn’t speed up the slide in, slide out motion. So, I want to take a closer look at what’s happening there.
I’ll start with DevTools. I’ll turn on the JavaScript profiler. Start recording. And then slide in. And then slide back out. Just like I saw before, onStoryClick is causing a forced synchronous layout. So I want to figure out a different way to create the slide in and slide out effect.

I’m inside the function called showStory.
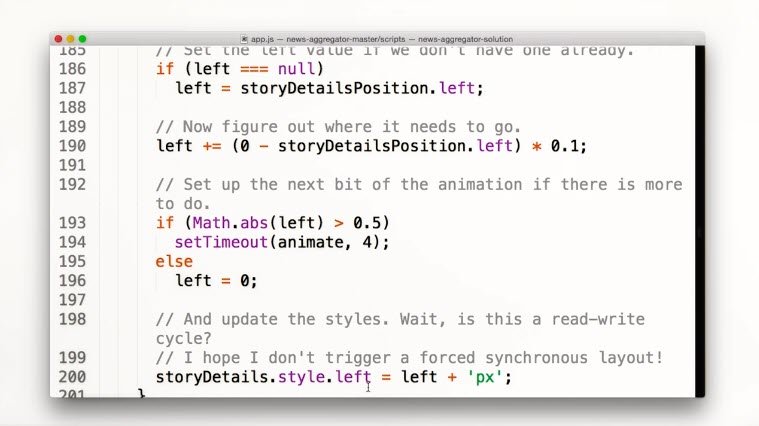
It looks like it’s causing the forced synchronous layout with the call to left, which causes the browser to run layout. And then the call to style.left, which causes the browser to run recalculate styles.
If this happens more than once in a frame, you’ve got a forced synchronous layout. I could refactor this in some way, but honestly, I just don’t want to deal with it. So, I’m going to go ahead and do this with CSS instead. So, what I decided to do is refactor showStory and hideStory which work the same way, with a couple changes to the classes of storyDetails.
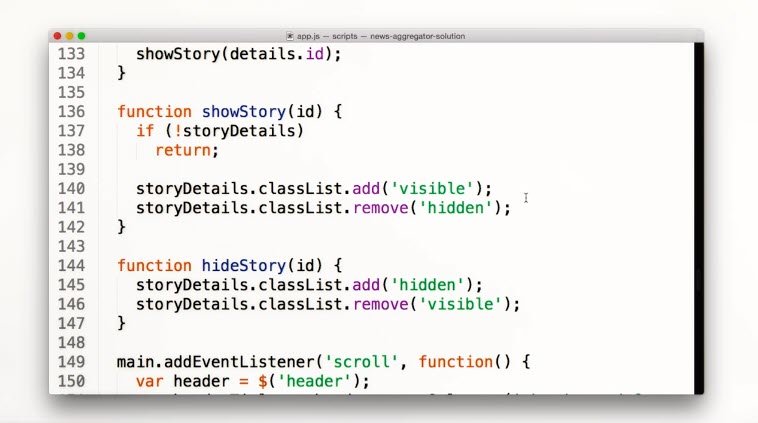
I’m simply adding and removing classes called visible and hidden.
I’ll show what this looks like in CSS. I’m looking at story details inside app.css.
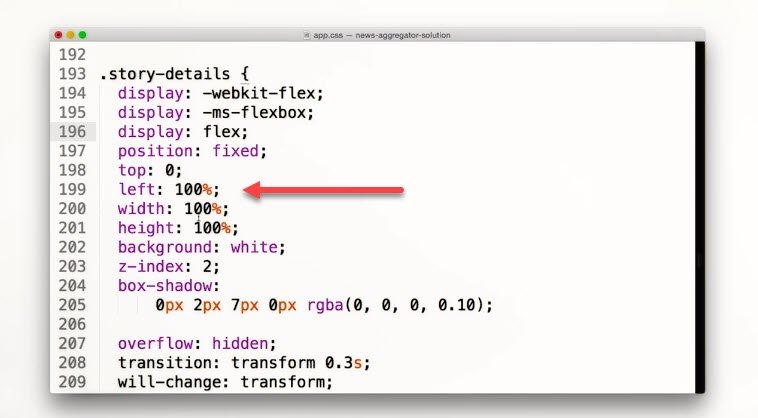
I’ve deleted a few things here, just to make it easier to show you everything that I want to. Notice this property left at 100%, this pushes the story details page off the screen. So what I wind up doing with visible and hidden is transforms to translate the x position, either all the way to the left or back to it’s original starting point.
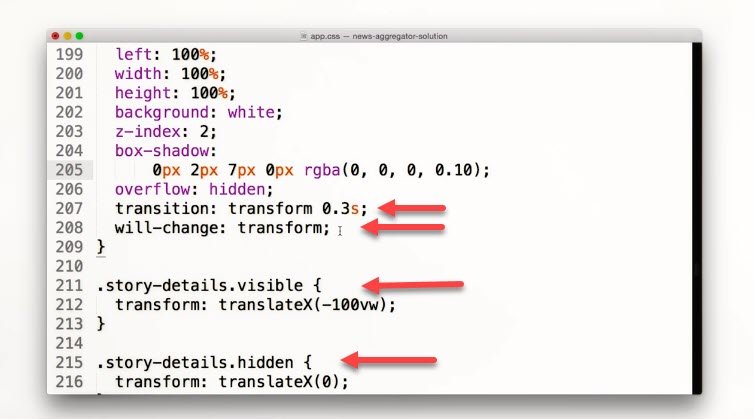
I’ve also gone ahead and given story-details the will-change: transform. Just to let the browser know that the story details will be sliding back and forth. To achieve the animation I’ve added transition transform with 0.3 seconds. So, it’ll take 0.3 seconds for story details to come in or slide back out.
Looking at these properties, you’ll probably see a few differences from where you started and that’s because I got rid of the opacity changes, because I didn’t think they were really doing anything. I think I’ve done a lot, but of course, the only way to really know for sure is to record a timeline trace.
That looked a lot better and the timeline is showing that that was a lot better. All the bars are well below the 60 fps line. I no longer need any JavaScript to animate the slide in and sliding out. And all the force synchronous layout warnings are gone.
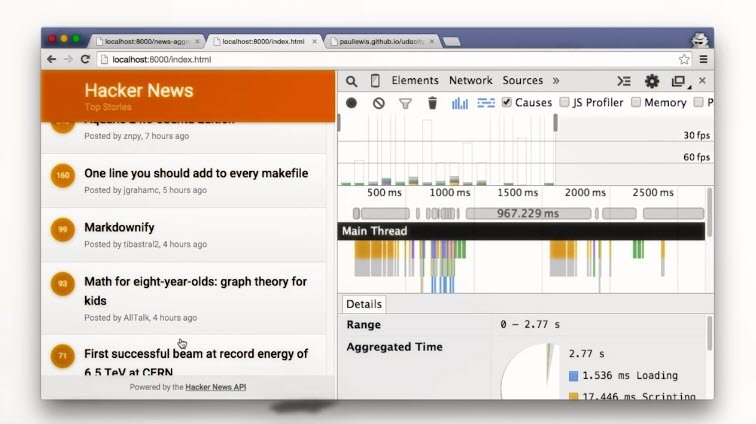
That is awesome news. Everything’s looking a lot better, but there’s still a lot more that can be done. For instance, the CSS in the app could be improved and some of the story loading could be off-loaded to web workers. Once again, see here for my full solution as well as some other fixes that you might want to try.
14.15 Course Outro
Congratulations! You’ve reached the end of the course. You’ve learned a load of tricks to get your apps to run at 60 frames a second. Remember, profile sites in your apps, figure out where your bottlenecks are and stomp out that jank. Basically, as always, performance matters.