Chapter 12 - HTML5 Canvas
Notes from Programming in HTML5 with JavaScript & CSS3 Training Guide by Glenn Johnson.
This is part of my study material for passing Microsoft’s Exam 70-480: Programming in HTML5 with JavaScript & CSS3 certification exam.
Prior to HTML5 we had to rely on something like Adobe Flash for drawing on a webpage. Now we have the ability to draw in HTML5 by using the <canvas> element.
We can display Scalable Vector Graphics by using the <svg> element. SVG is a language by which to define two-dimensional graphics in XML. The XML can then be rendered by the browser using the <svg> tag. Although you could learn and write SVG by hand, you will most likely use an image editor to create SVG graphics. The benefits of SVG is that they’re scalable.
This lesson presents the <canvas> element and demonstrates drawing on the canvas. Then the lesson covers <svg> from an implementation perspective rather than from a drawing perspective.
1. Drawing with canvas
The only significant attributes that <canvas> has are the height and width attributes. The content you place in the <canvas> element is displayed if the browser doesn’t support the canvas element.
<canvas id="myCanvas" width="800" height="600">
    You need a browser that supports HTML5!
</canvas>
The <canvas> element is invisible by default so we apply the following.
canvas {
    border: 1px solid #999;
}
2. Canvas element reference
The <canvas> element exposes an abundance of functionality through its canvas context, which is accessible using JavaScript. The element provides the following members.
- height Property that sets or gets the height of the canvas
- width Property that sets or gets the width of the canvas
- getContext() Method that accepts a parameter of
2dand returns aCanvasRenderingContext2Dobject that represents the canvas context - toDataUrl() Method that creates a URL that can be used with an element that requires an image URL, such as the
<img>element
3. Context object reference
The <canvas> element is simply a graphics container; the context object (CanvasRenderingContext2D) that is returned from the getContext() method is used to draw on the canvas.
The following is a list of the context object’s members.
- addColorStop() Method to set the colors and stop positions in a gradient object
- arc() Method to create an arc/curve
- actTo() Method to create an arc/curve between two tangents
- beginPath() Method to start a path or reset the current path
- bezierCurveTo() Method to create a cubic Bezier curve
- clearRect() Method to clear a given rectangle
- clip() Method to clip a region of any shape and size from the original canvas
- closePath() Method to create a path from the current point back to the starting point
- createImageData() Method to create a new, blank ImageData object
- createLinearGradient() Method to create a linear gradient
- createPattern() Method to repeat a specified element in a specified direction
- createRadialGradient() Method to create a radial/circular gradient
- data Property that gets an
ImageDataobject that contains the image data - drawImage() Method to draw an image, canvas, or video onto the canvas
- fill() Method to fill the drawing path
- fillRect() Method to draw a filled rectangle
- fillStyle Property that sets or gets the color, gradient, or pattern used to fill the drawing
- fillText() Method to draw filled text on the canvas
- font Property that sets or gets the font properties for text content
- getImageData() Method to get an
ImageDataobject that copies the pixel data for the specified rectangle on a canvas - globalAlpha Property that sets or gets the current alpha or transparency value fo the drawing
- globalCompositeOperation Property that sets or gets how a new image is drawn onto an existing image
- isPointInPath() Method that returns
trueif the specified point is in the current path - lineCap Property that sets or gets the style of the end caps for a line
- lineJoin Property that sets or gets the type of corner to create when two lines meet
- lineTo() Method that adds a new point and creates a line from that point to the last specified point in the canvas
- lineWidth Property that sets or gets the current line width
- measureText() Method that gets an object that contains the width of the specified text
- miterLimit Property that sets or gets the maximum miter length
- moveTo() Method that moves the path to the specified point in the canvas without creating a line
- putImageData() Method that puts the image data from a specified
ImageDataboject back onto the canvas - quadraticCurveTo() Method that creates a quadratic Bezier curve
- rect() Method that creates a rectangle
- restore() Method that pops the previously saved context from the stack
- rotate() Method that rotates the current drawing
- save() Method that pushes the state of the current context onto a stack
- scale() Method that scales the current drawing bigger or smaller
- setTransform() Method that resets the current transform to the identity matrix and then call the
transform()method - shadowBlur Property that sets or gets the blur level setting to use for shadows
- shadowColor Property that sets or gets the color setting to use for shadows
- shadowOffsetX Property that sets or gets the horizontal distance setting of the shadow from the shape
- shadowOffsetY Property that sets or gets the vertical distance setting of the shadow from the shape
- stroke() Method to draw the path you have defined
- strokeRect() Method to draw a rectangle without fill
- strokeStyle Property that sets or gets the color, gradient, or pattern used for strokes
- strokeText() Method that draws text on the canvas without fill
- textAlign Property that sets or gets the alignment setting for text content
- textBaseline Property that sets or gets the text baseline setting used when drawing text
- transform() Method that replaces the transformation matrix setting for the drawing
- translate() Method that remaps the (0,0) position on the canvas
4. Implementing the canvas
When working with the canvas object, you must get a reference to the canvas context. This can be accomplished by using the getContext() method, which accepts a parameter.
Currently the values for the parameter are 2d and webgl. WebGL focuses on more advanced three-dimensional drawing but this lesson will focus on the more mature 2d parameter which returns a CanvasRenderingContext2D object. This object will be referred to as the context object.
$(document).ready(function() {
    drawSomething();
});

function drawSomething() {
    var canvas = document.getElementById('myCanvas');
    var ctx = canvas.getContext('2d');
    ctx.fillRect(10, 50, 100, 200);
}
In this example, canvas is a reference to the <canvas> element whose id is myCanvas. After that, ctx is set to reference the context object, with which you can start drawing.
The coordinates of the drawing surface are represented as x, y where 0,0 is the upper-left corner of the canvas
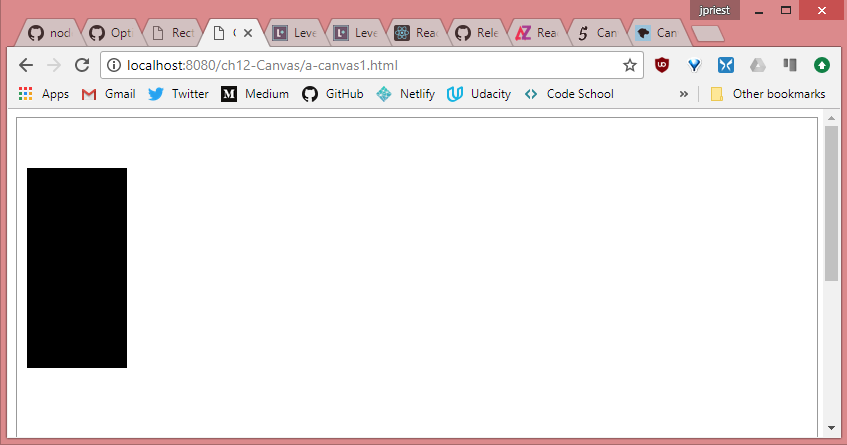
Live sample: https://james-priest.github.io/node_samples/ch12-Canvas/a-canvas1.html
Quick check
- What is the proper parameter to pass to the
getContextmethod on the canvas to create two-dimensional drawings?
Answer
2d
5. Drawing rectangles
The methods for creating rectangles accept four parameters. The first two are the x and y locations of the upper-left corder. The last two parameters represent the width and height of the rectangle. You can create rectangles by using one of the following methods.
- clearRect(x, y, w, h) Clear the specified rectangular area.
- fillRect(x, y, w, h) Draw a filled rectangular area.
- strokeRect(x, y, w, h) Draw an unfilled rectangular area.
The following code demonstrates this.
$(document).ready(function() {
    drawSomething();
});

function drawRectangle() {
    var canvas = document.getElementById('myCanvas'),
        ctx = canvas.getContext('2d'),
        offset = 15,
        clearOffset = 30,
        pushDownOffset = 10,
        height = 50,
        width = 100,
        count = 4;

    for (var i = 0; i < count; i++) {
        ctx.fillRect(i * (offset + width) + offset, offset, width, height);

        ctx.clearRect(i * (offset + width) + (clearOffset / 2) + offset,
            offset + (clearOffset / 2) + (pushDownOffset /2),
            width - clearOffset, height - clearOffset);

        ctx.strokeRect(i * (offset + width) + offset,
            (2 * offset) + height, width, height);
    }
}
In this example, the fillRect() method is used to create four rectangles. Each is spaced horizontally by the offset amount. Next the clearRect() method is used to clear a rectangular area that is inside the filled-in area. Finally, the strokeRect() method is used to create a second row, but these rectangles are not filled in.
Live sample: https://james-priest.github.io/node_samples/ch12-Canvas/b-rect1.html
So, drawing on the canvas does indeed require knowledge of JavaScript and the canvas context object.
6. Configuring drawing state
In the previous example, we did not set the fill color for fillRect() or the line thickness and color for strokeRect(). The canvas context has properties we can set before calling any of the drawing methods.
After we change a property, the new value is used for th subsequent drawing statements.
7. Setting fillStyle
We can set fill style to CSS color, gradient, or pattern
8. fillstyle: CSS color
This creates a solid color fill based on valid CSS color value such as a named color (black, red, etc.), hex value(#FF0000), or css function (rgb(), rgba(), hsl(), hsla()).
function drawUsingCssColor() {
    // var canvas = document.getElementById('myCanvas');
    var canvas = document.createElement('canvas'),
        ctx = canvas.getContext('2d'),
        offset = 10,
        size = 50;

    canvas.id = 'myCanvas';
    canvas.width = 800;
    canvas.height = 600;
    document.body.appendChild(canvas);

    ctx.fillStyle = "red";
    ctx.fillRect(offset + (0 * (offset + size)), offset, size, size);
    ctx.fillRect(offset + (1 * (offset + size)), offset, size, size);

    ctx.fillStyle = "#00FF00";
    ctx.fillRect(offset + (2 * (offset + size)), offset, size, size);
    ctx.fillRect(offset + (3 * (offset + size)), offset, size, size);

    ctx.fillStyle = "rgba(0, 0, 255, 0.25)";
    ctx.fillRect(offset + (4 * (offset + size)), offset, size, size);
    ctx.fillRect(offset + (5 * (offset + size)), offset, size, size);
}
In this example, fillStyle is set to “red” and two rectangles are created. Next, fillStyle is set to green, using “#00FF00” and two rectangles are created. Finally, fillStyle is set to blue with an opacity of 25 percent and two rectangles are created.
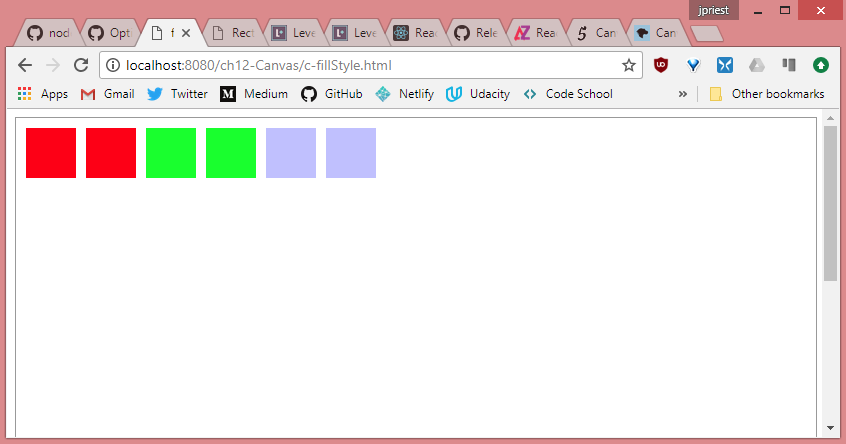
Live sample: https://james-priest.github.io/node_samples/ch12-Canvas/c-fillStyle1.html
9. fillstyle: Gradient
A CanvasGradient object that is created by the context’s createLinearGradient() or createRadialGradient() method to create a gradient fill.
The createLinearGradient() method accepts the x and y values of two points that are used to create a linear gradient, for example, createLinearGradient(x0, y0, x1, y1).
The createRadialGradient() accepts the x and y center and the radius of the two circles, for example, createRadialGradient(x0, y0, x1, y1, r1).
After the gradient object is created, call its addColorStop method to specify that a color is set at a location on the gradient. The addColorStop function takes two parameters; the first is the location, which is a value between 0 and 1 where 0 is the beginning of the gradient and 1 is the end of the gradients, and the second parameter is the color value.
function drawGradient() {
    // var canvas = document.getElementById('myCanvas');
    var canvas = document.createElement('canvas'),
        ctx = canvas.getContext('2d'),
        gradient = '',
        x0 = 0,
        y0 = 0,
        r0 = 0,
        x1 = 200,
        y1 = 0,
        r1 = 100,
        width = 300,
        height = 50,
        offset = 10;

    canvas.id = 'myCanvas';
    canvas.width = 800;
    canvas.height = 600;
    document.body.appendChild(canvas);

    gradient = ctx.createLinearGradient(x0, y0, x1, y1);
    addColorStops(gradient);
    ctx.fillStyle = gradient;
    ctx.fillRect(10, 0 * (height + offset), width, height);
    ctx.fillRect(100, 1 * (height + offset), width, height);

    y1 = 300;
    gradient = ctx.createLinearGradient(x0, y0, x1, y1);
    addColorStops(gradient);
    ctx.fillStyle = gradient;
    ctx.fillRect(10, 2 * (height + offset), width, height);
    ctx.fillRect(100, 3 * (height + offset), width, height);

    x0 = x1 = width / 2;
    y0 = y1 = 4 * (height + offset) + (height / 2);
    gradient = ctx.createRadialGradient(x0, y0, r0, x1, y1, r1);
    addColorStops(gradient);
    ctx.fillStyle = gradient;
    ctx.fillRect(10, 4 * (height + offset), width, height);
    ctx.fillRect(100, 5 * (height + offset), width, height);

    y0 = 5 * (height + offset) + (height / 2);
    y1 = y0 + 100;
    gradient = ctx.createRadialGradient(x0, y0, r0, x1, y1, r1);
    addColorStops(gradient);
    ctx.fillStyle = gradient;
    ctx.fillRect(10, 6 * (height + offset), width, height);
    ctx.fillRect(100, 7 * (height + offset), width, height);
}

function addColorStops(gradient) {
    gradient.addColorStop('0', 'magenta');
    gradient.addColorStop('.25', 'blue');
    gradient.addColorStop('.50', 'green');
    gradient.addColorStop('.75', 'yellow');
    gradient.addColorStop('1.0', 'red');
}
This example code displays two rectangles for each test, in which the second rectangle is offset from the first rectangle, so you can see how the gradient is rendered relative to the canvas, not the rectangle.

Live sample: https://james-priest.github.io/node_samples/ch12-Canvas/c-fillStyle2.html
The first pair of rectangles demonstrates a horizontal linear gradient when y0 and y1 are equal.
The second pair of rectangles shows what happens when y1 is different from y0. In this example, if you draw a line from x0, y0 to x1, y.1, the line will be angled downward. The gradient is rendered along this line and displays as a diagonal linear gradient.
The third pair of rectangles illustrates the radial gradient when x0=x1 and y0=y1, but r0 us set to zero when r1 is set to 100. Becasue both points are the same, the radial gradient is circular. Because r0 is zero, the gradient starts in the center. The gradient ends at r1, which is set to 100.
The last pair of rectangles shows what happens when the two points are not the same. In this case, x0 and x1 are the same, but y0 and y1 are different, which produces a non-circular gradient.
10. fillstyle: Pattern
A CanvasPattern object that is created by using the context’s createPattern() method and creates a pattern fill. The createPattern method takes an image parameter and a direction parameter. The image is a reference to an <img> element, and the direction is a string containing no-repeat, repeat-x, repeat-y, or repeat.
By using the image above, the following code creates a pattern that is assigned to the fillStyle property.
function drawPattern() {
    // var canvas = document.getElementById('myCanvas');
    var canvas = document.createElement('canvas'),
        ctx = canvas.getContext('2d');

    canvas.id = 'myCanvas';
    canvas.width = 800;
    canvas.height = 600;
    document.body.appendChild(canvas);

    // create new image object to use as pattern
    var img = new Image();
    img.src = "assets/images/shapes.png";
    img.onload = function() {
        // create pattern
        var ptrn = ctx.createPattern(img, 'repeat');
        ctx.fillStyle = ptrn;
        ctx.fillRect(0, 0, 700, 500);
    };
}
In this example, instead of creating an <img> element, the image is dynamically created and its source is set to the shapes.png file. Next, the onload event of the image is subscribed to that creates the pattern on the canvas after shapes.png is loaded.
Live sample: https://james-priest.github.io/node_samples/ch12-Canvas/c-fillStyle3.html
11. Setting lineWidth
The lineWidth property specifies the thickness of any line you draw. The following code example draws rectangles by using different lineWidth settings.
function drawlineWidth() {
    // var canvas = document.getElementById('myCanvas');
    var canvas = document.createElement('canvas'),
        ctx = canvas.getContext('2d'),
        offset = 40,
        width = 5,
        height = 5,
        i = 0,
        centerX = 400,
        centerY = 300;

    canvas.id = 'myCanvas';
    canvas.width = 800;
    canvas.height = 600;
    document.body.appendChild(canvas);

    for( i = 1; i < 15; i++) {
        ctx.lineWidth = i;
        ctx.strokeRect(centerX - (width / 2) - (i * offset / 2),
            centerY - (height / 2) - (i * offset / 2),
            width + (i * offset), height + (i * offset));
    }
}
In this example, lineWidth is changed on each iteration of the for loop; the drawn rectangle starts small and gets larger with each iteration.
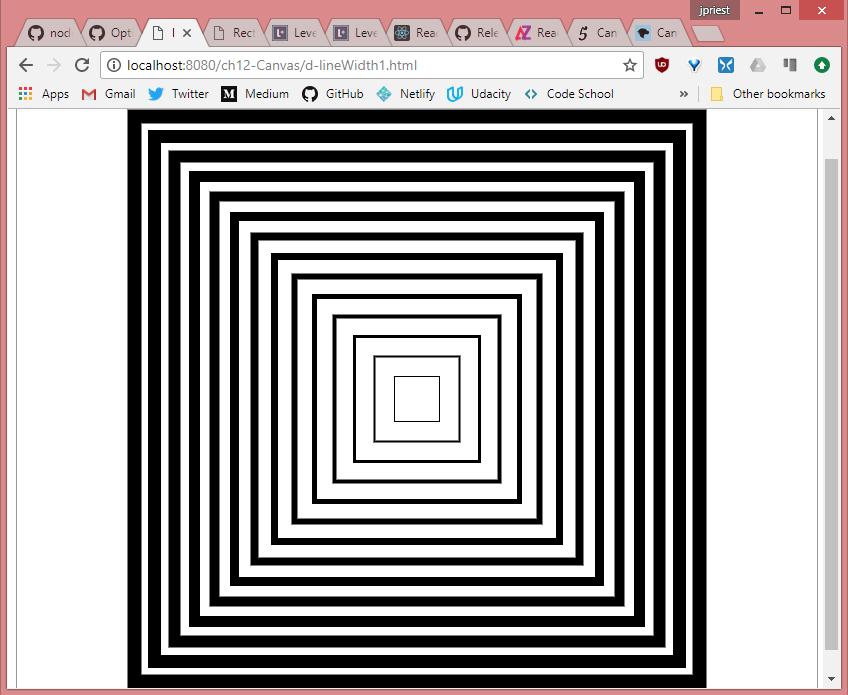
Live sample: https://james-priest.github.io/node_samples/ch12-Canvas/d-lineWidth1.html
12. Setting lineJoin
The lineJoin property specifies the way lines that join each other are drawn. You can set the lineJoin property to ‘round’, ‘bevel’, or ‘miter’. The default is ‘miter’. The difference between these settings is most noticeable with thicker lines.
The following code shows the creation of three rectangles that have different lineJoin settings.
function drawLineJoin() {
    // var canvas = document.getElementById('myCanvas');
    var canvas = document.createElement('canvas'),
        ctx = canvas.getContext('2d');

    canvas.id = 'myCanvas';
    canvas.width = 800;
    canvas.height = 600;
    document.body.appendChild(canvas);

    ctx.lineWidth = 20;

    ctx.lineJoin = 'round';
    ctx.strokeRect(20, 20, 50, 50);

    ctx.lineJoin = 'bevel';
    ctx.strokeRect(100, 100, 50, 50);

    ctx.lineJoin = 'miter';
    ctx.strokeRect(180, 180, 50, 50);
}
In this example, the first rectangle’s lineJoin property is set to ‘round’. This produces a rectangle with rounded corners. The second is set to ‘bevel’, which produces a rectangle with beveled corners. Finally, the third is set to ‘miter’, which produces a rectangle with mitered, or pointy, corners.
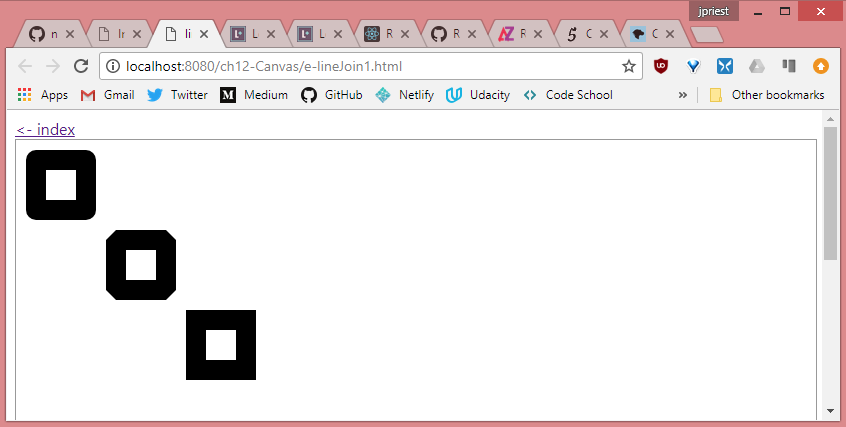
Live sample: https://james-priest.github.io/node_samples/ch12-Canvas/e-lineJoin1.html
12. Setting strokeStyle
The strokeStyle property specifies the way you want to draw lines. This setting is the same as the fillStyle property described earlier.
function drawGradientStroke() {
    // var canvas = document.getElementById('myCanvas');
    var canvas = document.createElement('canvas'),
        ctx = canvas.getContext('2d'),
        gradient ='',
        x0 = 0,
        y0 = 0,
        r0 = 0,
        x1 = 200,
        y1 = 0,
        r1 = 100,
        width = 300,
        height = 40,
        offset = 25;

    canvas.id = 'myCanvas';
    canvas.width = 800;
    canvas.height = 600;
    document.body.appendChild(canvas);

    ctx.lineWidth = 15;
    gradient = ctx.createLinearGradient(x0, y0, x1, y1);
    addColorStops(gradient);
    ctx.strokeStyle = gradient;
    ctx.strokeRect(10, 0 * (height + offset) + 10, width, height);
    ctx.strokeRect(100, 1 * (height + offset)+10, width, height);

    y1 = 300;
    gradient = ctx.createLinearGradient(x0, y0, x1, y1);
    addColorStops(gradient);
    ctx.strokeStyle = gradient;
    ctx.strokeRect(10, 2 * (height + offset)+10, width, height);
    ctx.strokeRect(100, 3 * (height + offset)+10, width, height);

    x0 = x1 = width / 2;
    y0 = y1 = 4 * (height + offset) + (height / 2);
    gradient = ctx.createRadialGradient(x0, y0, r0, x1, y1, r1);
    addColorStops(gradient);
    ctx.strokeStyle = gradient;
    ctx.strokeRect(10, 4 * (height + offset)+10, width, height);
    ctx.strokeRect(100, 5 * (height + offset)+10, width, height);

    y0 = 5 * (height + offset) + (height / 2);
    y1 = y0 + 100;
    gradient = ctx.createRadialGradient(x0, y0, r0, x1, y1, r1);
    addColorStops(gradient);
    ctx.strokeStyle = gradient;
    ctx.strokeRect(10, 6 * (height + offset)+10, width, height);
    ctx.strokeRect(100, 7 * (height + offset)+10, width, height);
}

function addColorStops(gradient) {
    gradient.addColorStop('0', 'magenta');
    gradient.addColorStop('.25', 'blue');
    gradient.addColorStop('.50', 'green');
    gradient.addColorStop('.75', 'yellow');
    gradient.addColorStop('1.0', 'red');
}
This example is a modified version of the drawGradient() function.
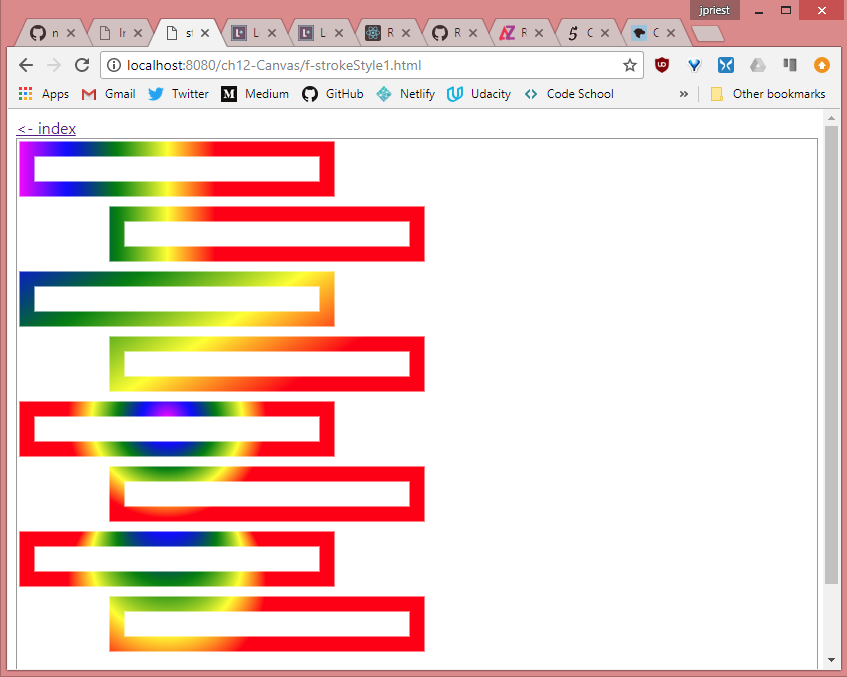
Live sample: https://james-priest.github.io/node_samples/ch12-Canvas/f-strokeStyle1.html
13. Save & Restore drawing state
It is possible to save all the context object properties to a stack, which is a last-in, first-out (LIFO) collection. This does not save the actual canvas; just the settings are saved. The save method saves the current setting, and the restore method restores the settings as shown below.
function saveRestore() {
    // var canvas = document.getElementById('myCanvas');
    var canvas = document.createElement('canvas'),
        ctx = canvas.getContext('2d');

    canvas.id = 'myCanvas';
    canvas.width = 800;
    canvas.height = 600;
    document.body.appendChild(canvas);

    ctx.lineWidth = 20;
    ctx.strokeStyle = 'green';
    ctx.lineJoin = 'round';
    ctx.strokeRect(20, 20, 50, 50);
    ctx.save();

    ctx.lineWidth = 10;
    ctx.strokeStyle = 'red';
    ctx.lineJoin = 'bevel';
    ctx.strokeRect(100, 100, 50, 50);

    ctx.restore();
    ctx.strokeRect(180, 180, 50, 50);
}
In this example, the lineWidth, strokeStyle, and lineJoin properties are set, and a rectangle is drawn. The save() method is called to save the settings. The settings are modified, and a new rectangle is drawn with the new settings. Finally, the restore() method is called which pops (gets and removes) the settings from the stack, and a rectangle is drawn.
The rectangle has the same property settings as the first one.
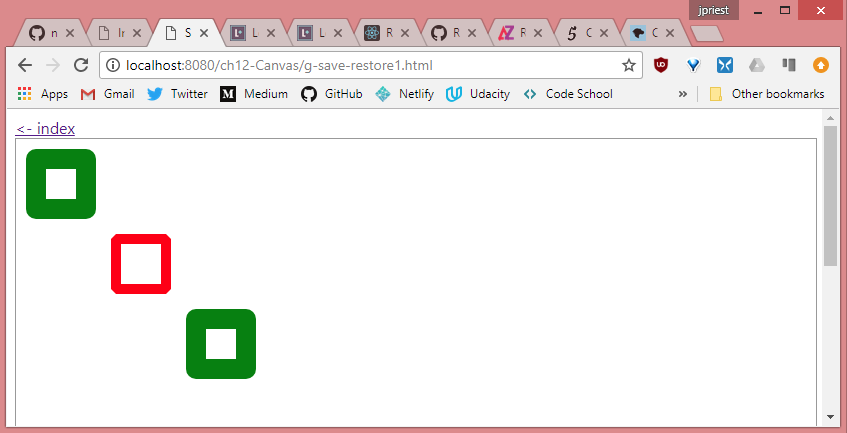
Live sample: https://james-priest.github.io/node_samples/ch12-Canvas/g-save-restore1.html
You can save many times to create a stack of settings and then restore many times to empty the stack..
14. Drawing with paths
A path is a set of lines that are used to draw shapes. Each line is called a sub-path. Each sub-path has a start and an end, and the end one sub-path is typically where the next sub-path starts. The collection of sub-paths makes a shape.
The sequence for creating a shape is as follows.
- Start a path by calling the
beginPath()method. - Go to the starting position by calling the
moveTo()method. - Draw sub-paths calling methods such as
lineTo()andrect(). - End the path by optionally calling the
closePath()method. - Render the filled shape or outlined shape by calling
fill()orstroke()methods, respectively.
15. Drawing lines
The easiest path to create is one composed of lines. This is accomplished by using the lineTo() method, which accepts x and y parameters. The following is an example of using lines to create shapes that have a yellow outline and a green fill.
$(document).ready(function() {
    drawLine();
});

function drawLine() {
    // var canvas = document.getElementById('myCanvas');
    var canvas = document.createElement('canvas'),
        ctx = canvas.getContext('2d');

    canvas.id = 'myCanvas';
    canvas.width = 800;
    canvas.height = 600;
    document.body.appendChild(canvas);

    ctx.fillStyle = 'green';
    ctx.strokeStyle = 'gold';
    ctx.lineWidth = 10;

    ctx.beginPath();
    ctx.moveTo(100, 250);
    ctx.lineTo(150, 350);
    ctx.lineTo(50, 350);
    ctx.closePath();
    ctx.fill();

    ctx.beginPath();
    ctx.moveTo(150, 250);
    ctx.lineTo(250, 250);
    ctx.lineTo(200, 350);
    ctx.closePath();
    ctx.fill();
    ctx.stroke();

    ctx.beginPath();
    ctx.moveTo(300, 250);
    ctx.lineTo(350, 350);
    ctx.lineTo(250, 350);
    ctx.fill();
    ctx.stroke();

    ctx.beginPath();
    ctx.moveTo(500, 250);
    ctx.lineTo(500, 350);
    ctx.moveTo(450, 300);
    ctx.lineTo(550, 300);
    ctx.fill();
    ctx.stroke();
}
This example draws the four shapes below.
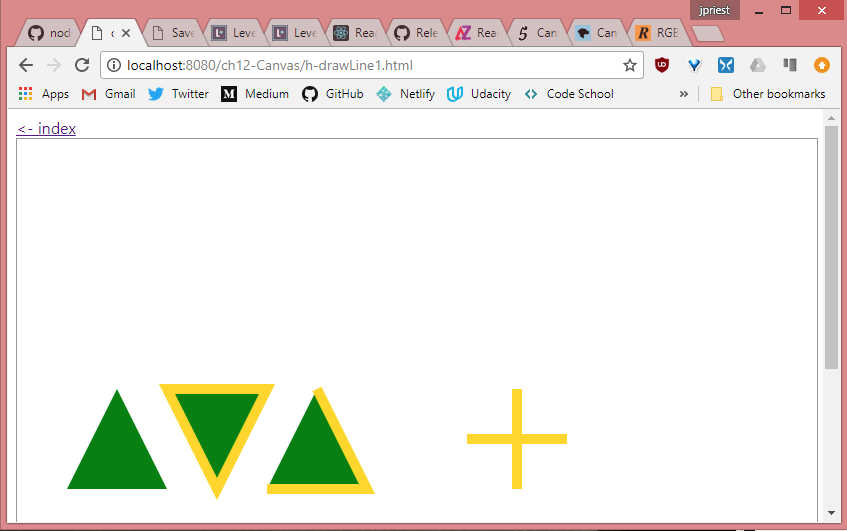
Live sample: https://james-priest.github.io/node_samples/ch12-Canvas/h-drawLine1.html
The first shape is a triangle. It’s created by drawing two lines and then calling the closePath() method, which draws a line from the end back to the start. The fill() method is called to fill the triangle with green. There is no outline because the stroke() method was not called.
The second shape is also a triangle and is drawn like the first triangle, but the stroke() method is called after the fill() method. the stroke() method creates a yellow outline.
The third shape is also a triangle, but this code doesn’t call the closePath() method. In this example, the fill() method implicitly calculates the fill area, but because the closePath() method is not called, there is no line from the end to the start; therefore no outline (or stroke) from the end to the start.
The fourth shape is a plus sign. This demonstrates the use of the moveTo() method to create a line that doesn’t start where the previous line ended. The stroke() method creates the lines, but the fill() method doesn’t render anything.
16. Drawing rectangles
You can add rectangles to you path by calling the rect() method. Keep in mind that if all you need to do is draw a rectangle, you can use the fillRect() and the strokeRect() methods.
The rect() method is useful when you are defining a complex shape. Instead of adding many lineTo() calls to draw a rectangle, you just call the rect() method. The following is an example fo creating a shape that consists of a triangle and rectangle.
function drawRect() {
    // var canvas = document.getElementById('myCanvas');
    var canvas = document.createElement('canvas'),
        ctx = canvas.getContext('2d');

    canvas.id = 'myCanvas';
    canvas.width = 800;
    canvas.height = 600;
    document.body.appendChild(canvas);

    ctx.fillStyle = 'green';
    ctx.strokeStyle = 'gold';
    ctx.lineWidth = 10;

    ctx.beginPath();
    ctx.moveTo(100, 300);
    ctx.lineTo(150, 250);
    ctx.lineTo(200, 300);
    ctx.rect(100, 300, 100, 100);
    ctx.fill();
    ctx.stroke();
}
The rendered output is below. Notice that the triangle and the rectangle are outlined.
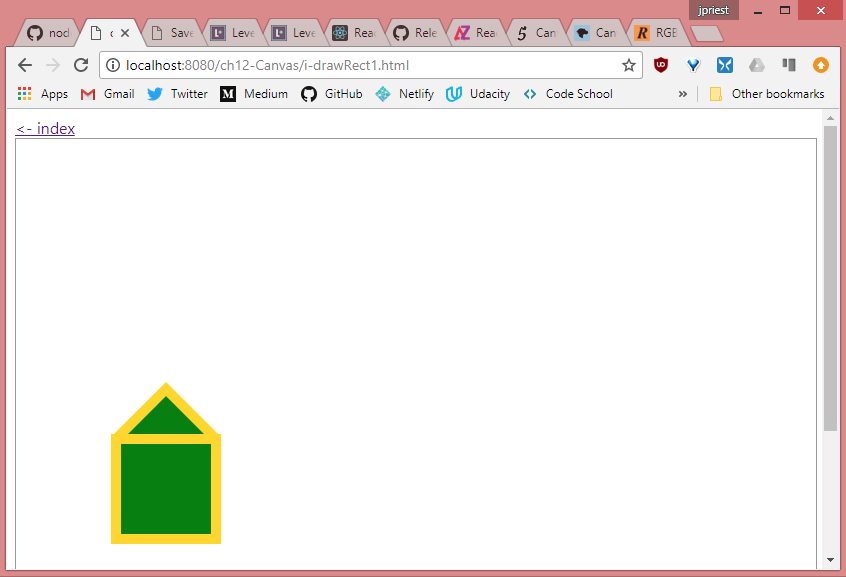
Live sample: https://james-priest.github.io/node_samples/ch12-Canvas/i-drawRect1.html
Quick check
- What are the four parameters of the
rect()method?Quick check answer
- The first and second parameters are the x and y coordinates of the upper-left corner of the rectangle. The third parameter is the width, and the fourth is the height.
17. Ordering fill & stroke method calls
You might be wondering whether there is a difference between calling fill() and then stroke() versus calling stroke() then fill(). There is a difference, but before the difference is displayed, you need to understand how the stroke is rendered.
When stroke is called, the outline is created using the current lineWidth property. Half of lineWidth is outside the shape, and half is inside. The part of the outline that is inside the shape overwrites the fill if the stroke() method is called after the fill() method.
However, if the fill() method is called after the stroke method, the fill overwrites the stroke method are called.
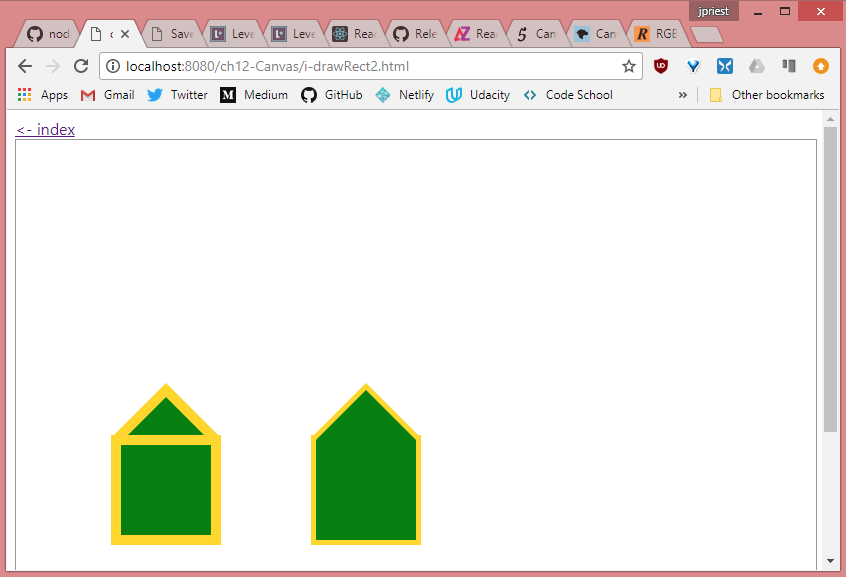
Live sample: https://james-priest.github.io/node_samples/ch12-Canvas/i-drawRect2.html
The rendered output of the outline of the second shape is narrow compared to the outline of the first shape, and the second shape does not have the horizontal line of the triangle. These differences result from the fill method being called after the stroke method so that fill overwrites and previous color.
18. Drawing arcs using arcTo
In addition to drawing straight lines, you can draw curved lines by using the arc() and arcTo() methods on the context object.
The arcTo() method accepts x1 and y1 coordinate that define a point through which the arc lines must pass, followed by an x2 and y2 coordinate that define the endpoint, followed by the radius of the arc. Although only two points are provided as parameters, a third point (x0, y0) is the starting point of the arc. The third point is the ending point of the previous sub-path.
Drawing an arc by using the arcTo() method can be confusing. To understand how arcTo() works, perform the following steps.
- On a piece of paper, draw a line through (x0, y0) and (x1, y1).
- Draw a line through (x1, y1) and (x2, y2).
- On a separate piece of paper, draw a circle of a radius r and cut it out.
- Place the circle on the paper that has the two lines and slide the circle down between the line that contains (x0, y0) and the line that contains (x2, y2) until it just touches both lines. The two points where the circle touches the lines are called tangent points, where t1 is closest to (x0, y0) and t2 is closest to (x2, y2).
- Draw a line from point (x0, y0) to the first tangent point on the line from (x0, y0) to (x1, y1).
- Draw an arc from that tangent point to the other tangent point on the line from (x1, y1) to (x2, y2) along the circumference of the circle.
- The endpoint of
arcTo()is the second tangent point on the line from (x1, y1) to (x2, y2).
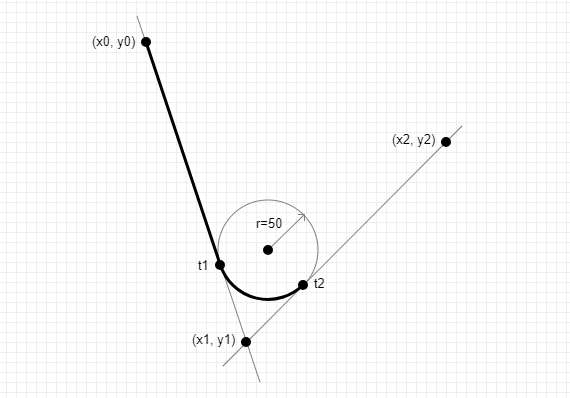
Live sample: https://james-priest.github.io/node_samples/ch12-Canvas/j-arcTo1.html
In this example, the radius of the circle is small, so the circle is slid down past (x0, y0) and (x2, y2) until it touches the lines. In the example, t1 is between (x0, y0) and (x1, y1), whereas t2 is between (x1, y1) and (x2, y2). There is some distance between (x0, y0) and t1, so this arc starts as a straight line until it reaches t1. At t1, the curve starts until it reaches t2, where the are ends.
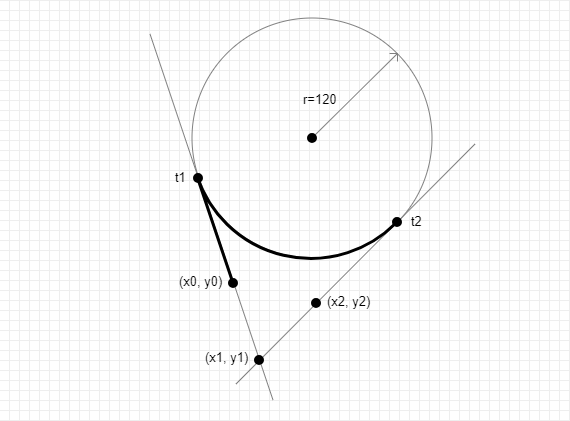
Live sample: https://james-priest.github.io/node_samples/ch12-Canvas/j-arcTo3.html
In the second example, the radius is much larger, so the circle is slid up until it touches the lines, but this time, t1 is outside (x0, y0) and t2 is outside (x2, y2). There is still some distance between (x0, y0) and t1, so a straight line is drawn between the two points. At t1, the curve starts until it reaches t2, where the arc ends.
Consider the following code example that draws two lines and then creates an arc by using the arcTo() method.
function drawArcTo() {
    // var canvas = document.getElementById('myCanvas');
    var canvas = document.createElement('canvas'),
        ctx = canvas.getContext('2d');

    canvas.id = 'myCanvas';
    canvas.width = 800;
    canvas.height = 600;
    document.body.appendChild(canvas);

    // lines
    ctx.strokeStyle = 'gray';
    ctx.lineWidth = 1;
    ctx.beginPath();
    ctx.moveTo(300, 200);
    ctx.lineTo(400, 500);
    ctx.lineTo(600, 300);
    ctx.stroke();

    // arc
    ctx.strokeStyle = 'black';
    ctx.lineWidth = 5;
    ctx.beginPath();
    ctx.moveTo(300, 200);
    ctx.arcTo(400, 500, 600, 300, 50);
    ctx.stroke();
}
In this example, the lines are drawn to depict the lines from the previous example. The lines are gray, and the lineWidth is set to 1. The arc is drawn by using the arcTo() method. This starting point is 300, 200, the second point is 400, 500, and the last point is 600, 300. The radius is set to 50.
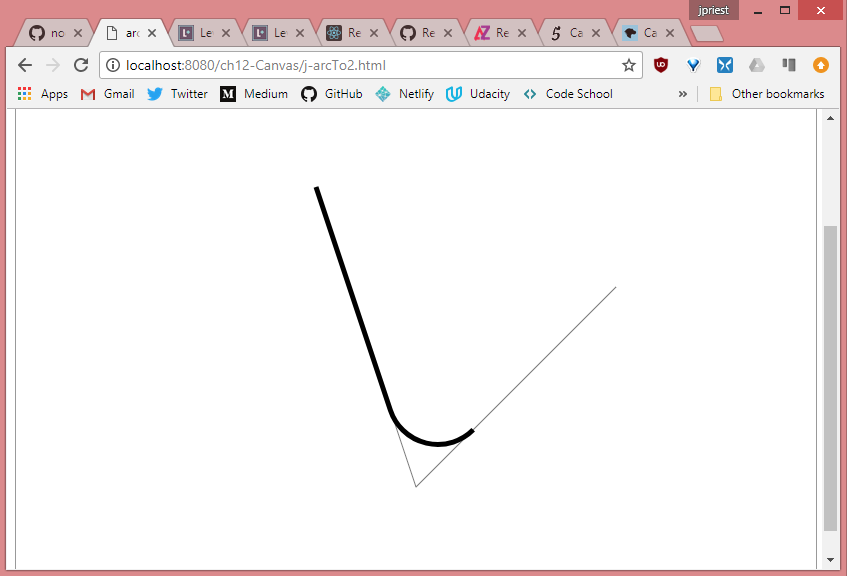
Live sample: https://james-priest.github.io/node_samples/ch12-Canvas/j-arcTo2.html
Because the starting point is always the ending point of the previous sub-path (or, in this case, the moveTo location), the stroke continues from that point until it reaches the first tangent, and then the curve starts until it reaches the second tangent, and then the arc is finished.
In this code example the points stay the same, but the radius is changed from 50 to 120.
function drawArcTo() {
    // var canvas = document.getElementById('myCanvas');
    var canvas = document.createElement('canvas'),
        ctx = canvas.getContext('2d');

    canvas.id = 'myCanvas';
    canvas.width = 800;
    canvas.height = 600;
    document.body.appendChild(canvas);

    // lines
    ctx.strokeStyle = 'gray';
    ctx.lineWidth = 1;
    ctx.beginPath();
    ctx.moveTo(300, 200);
    ctx.lineTo(400, 500);
    ctx.lineTo(600, 300);
    ctx.stroke();

    // arc
    ctx.strokeStyle = 'black';
    ctx.lineWidth = 5;
    ctx.beginPath();
    ctx.moveTo(374, 423);
    ctx.arcTo(400, 500, 600, 300, 120);
    ctx.stroke();
}
The radius of this circle has a profound impact on the rendered arc. In addition, because the circle is slid into the angle that’s formed by the line (x0, y0) is on and the line (x2, y2) is on, you can’t possibly create an arc that is greater than 180 degrees because the circle will always touch these lines to create a tangent t1 and t2 before the arc reaches 180 degrees.
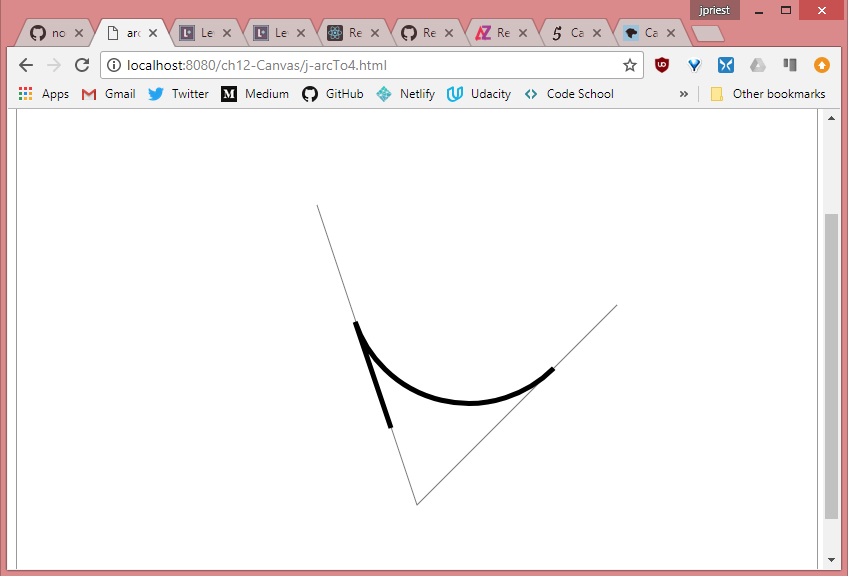
Live sample: https://james-priest.github.io/node_samples/ch12-Canvas/j-arcTo4.html
19. Drawing arcs using arc
The arc() method is much simpler to use than the arcTo() method. The arc() method can be used to draw a circle or any part of a circle. This is different from the behavior of the arcTo() method, which cannot draw more than half a circle and might produce line with the arc in an effort to continue a path without breaking te stroke.
the arc() method accepts x and y coordinates as the center of the circle used to draw the arc, followed by the radius of the circle that the arc will use, followed by the starting angle and the ending angle. You can add a direction parameter that indicates the direction of the arc. The following example code shows how to create a circle by using the arc method.
function drawArc() {
// var canvas = document.getElementById('myCanvas');
var canvas = document.createElement('canvas'),
ctx = canvas.getContext('2d');
canvas.id = 'myCanvas';
canvas.width = 800;
canvas.height = 600;
document.body.appendChild(canvas);
ctx.strokeStyle = 'blue';
ctx.fillStyle = 'gold';
ctx.lineWidth = 5;
ctx.beginPath();
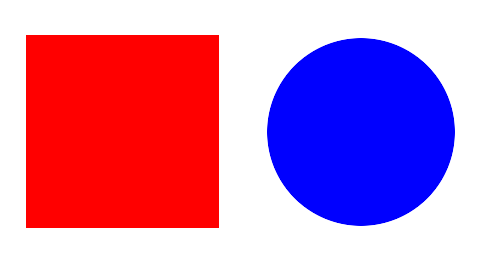
ctx.arc(400, 300, 100, 0, 2 * Math.PI);
ctx.fill();
ctx.stroke();
}
In this example, the center of the circle is 400, 300, which is the middle of the canvas. The radius is set to 100. The starting location must be a value between 0 and 6.283185, which is 2 * PI. The ending location must also be a value between 0 and 6.283185.
The value 0 and 6.283185 can be used to represent the farthest right-side point of the circle. The value of 3.14159 (PI) is the farthes left-side point of the circle. The uppermost point of the circle is 1.5 * PI, while the lowermost point of the circle is .5 * PI. The rendered canvas is shown below.
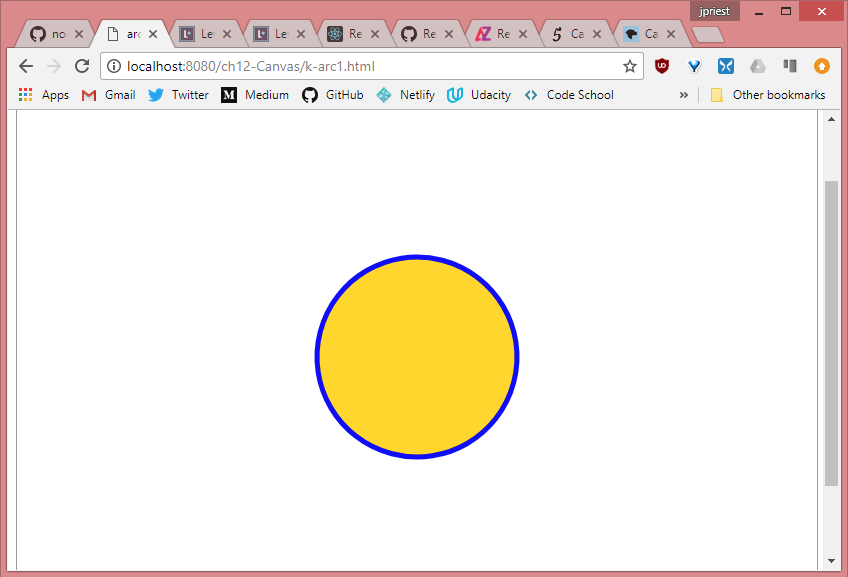
Live sample: https://james-priest.github.io/node_samples/ch12-Canvas/k-arc1.html
To draw an arc that represents part of the circle, you need valid start and end locations, and you need to consider the optional direction parameter. By default, the stroke is rendered clockwise, which means that the direction is set to false. Consider the following example where you provide a start location of 0 and an end location of 1.5 * PI.
function drawArc() {
    // var canvas = document.getElementById('myCanvas');
    var canvas = document.createElement('canvas'),
        ctx = canvas.getContext('2d');

    canvas.id = 'myCanvas';
    canvas.width = 800;
    canvas.height = 600;
    document.body.appendChild(canvas);

    ctx.strokeStyle = 'blue';
    ctx.fillStyle = 'gold';
    ctx.lineWidth = 5;

    ctx.beginPath();
    ctx.arc(400, 300, 100, 0, 1.5 * Math.PI);
    ctx.fill();
    ctx.stroke();
}
The image of the arc below shows that three-quarters of the circle is rendered. If you wanted to render only the quarter of the circle that’s missing you have two options.
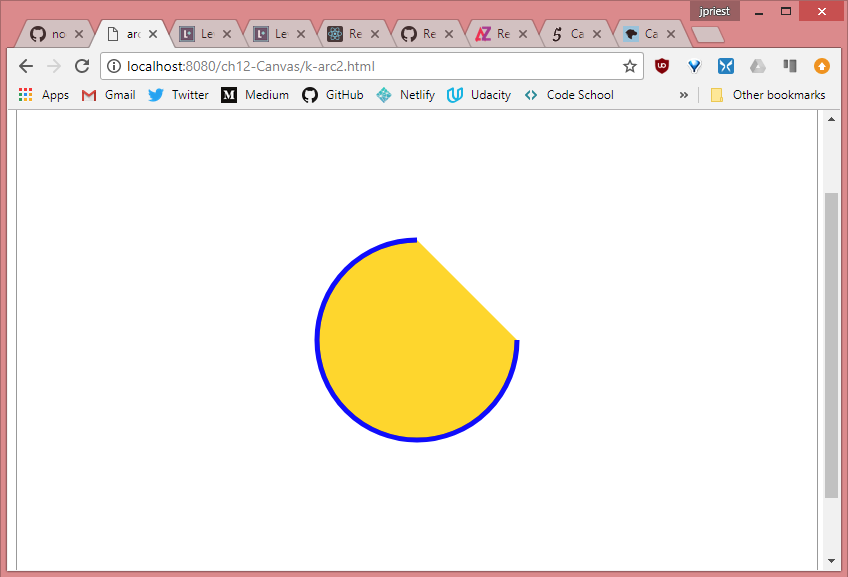
Live sample: https://james-priest.github.io/node_samples/ch12-Canvas/k-arc2.html
One solution is to set the start location to 1.5 * Math.PI and the end location to 0. This is because the engine renders the stroke clockwise, so the arc will start rendering at the uppermost point of the circle and stop at the rightmost point of the circle.
function drawArc() {
    // var canvas = document.getElementById('myCanvas');
    var canvas = document.createElement('canvas'),
        ctx = canvas.getContext('2d');

    canvas.id = 'myCanvas';
    canvas.width = 800;
    canvas.height = 600;
    document.body.appendChild(canvas);

    ctx.strokeStyle = 'blue';
    ctx.fillStyle = 'gold';
    ctx.lineWidth = 5;

    ctx.beginPath();
    ctx.arc(400, 300, 100, 0, 1.5 * Math.PI, true);
    ctx.fill();
    ctx.stroke();
}
The other solution is to leave the start at 0 and the end at 1.5 * Math.PI but add the optional direction parameter, passing in a value of true.
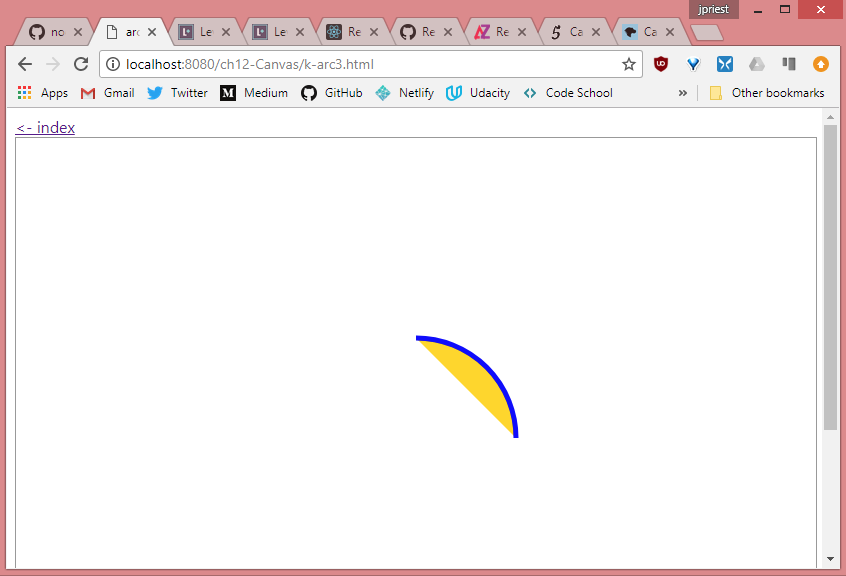
Live sample: https://james-priest.github.io/node_samples/ch12-Canvas/k-arc3.html
This causes the stroke rendering to go counterclockwise, which renders the quarter circle.
20. Drawing text
You can also draw text on the canvas by using the fillText() or strokeText() method. Support for drawing text is somewhat basic. Both methods require you to pass the text to be drawn as the first parameter, followed by x and y coordinates that specify where the text is drawn.
The exact meaning of the coordinates depends on the value of the textAlign and the textBaseline properties, but the default is that the coordinate is at the lower-left corner of the text that’s drawn.
In addition to the methods, the following properties can be set to control the look of the rendered text.
- font Sets the font type, size, and family, delimited by spaces. The style can be normal, italic, or bold. The size can be a CSS size. The family represents the font family, which can be a generic font, such as
sans serif, or a specific font such asArialorCourier. - textAlign Sets the horizontal alignment of the text in relation to the coordinate that is passed into the
fillText()orstrokeText()method. Can bestart,end,left,right, orcenter. Note thatstartandleftare the same, andendandrightare the same. - textBaseline Sets the vertical alignment of the text in relation to the coordinate that is passed into the
fillText()orstrokeText()method. Can be top, hanging, middle, alpha-betic, ideographic, or bottom.
The following example draws a line across the canvas, through its center point (400, 300). After that, “Hello” is drawn using the coordinate of 400, 300.
function drawText() {
    // var canvas = document.getElementById('myCanvas');
    var canvas = document.createElement('canvas'),
        ctx = canvas.getContext('2d');

    canvas.id = 'myCanvas';
    canvas.width = 800;
    canvas.height = 600;
    document.body.appendChild(canvas);

    ctx.strokeStyle = 'magenta';
    ctx.fillStyle = 'gold';
    ctx.lineWidth = 2;
    ctx.font = "bold 100pt TimesNewRoman";

    ctx.beginPath();
    ctx.moveTo(100, 300);
    ctx.lineTo(700, 300);
    ctx.stroke();

    ctx.strokeStyle = "blue";
    ctx.fillText('Hello', 400, 300);
    ctx.strokeText('Hello', 400, 300);
}
The line is drawn as its own path, and then the stroke color is changed to blue, but there is no need to start a new path because fillText() and strokeText() create their own path.
The fillText() method automatically fills the text without requiring a call to the fill method. The strokeText() automatically outlines the text;
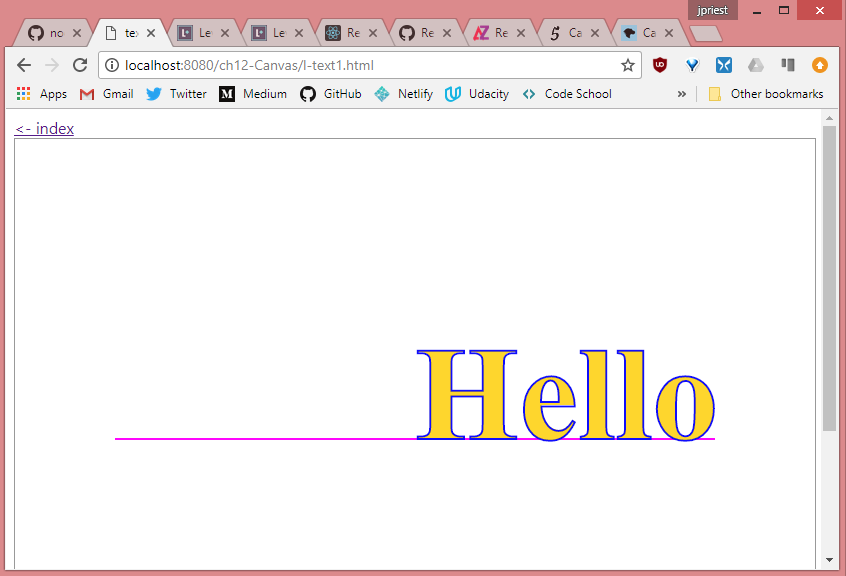
Live sample: https://james-priest.github.io/node_samples/ch12-Canvas/l-text1.html
The provided coordinate of 400, 300 is at the lower left of the rendered text, which means that the default value of the textAlign property is start or left, and the defgault value of the textBaseline is bottom.
If you change the textAlign property to center and change the textBaseline property to middle, the text will centered horizontally and vertically within the canvas.
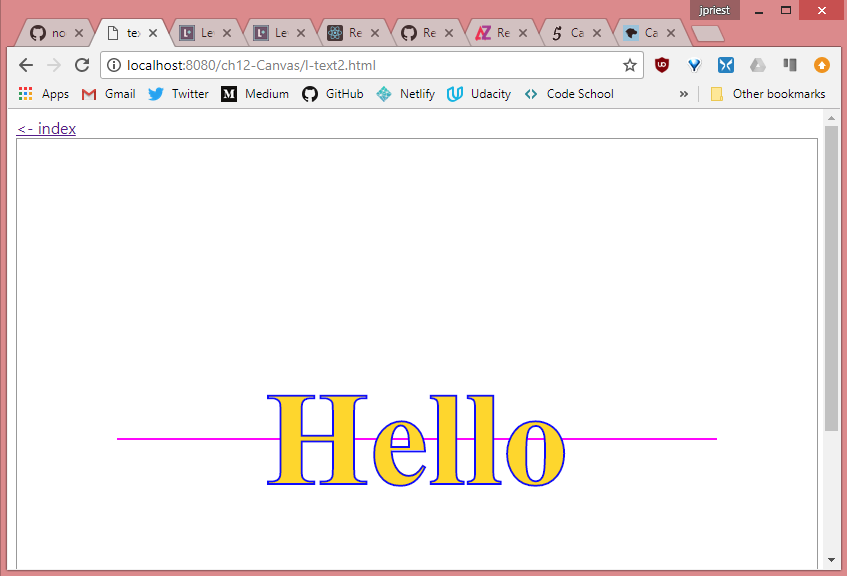
Live sample: https://james-priest.github.io/node_samples/ch12-Canvas/l-text2.html
21. Drawing with images
In addition to drawing shapes, you might want to place images on the canvas. You can do this by using the drawImage() method of the context object.
The drawImage() method can accept either three or five arguments. The first argument is the source of the image, which can be an <img> or <video> element or another <canvas> element. When the <video> element is used, a snapshot of the frame that is currently displayed is used as the image.
When passing three arguments to the drawImage() method, the second and third arguments are the x and y coordinates of the upper-left corder of the image.
You can also create the <img> element in your JavaScript, which is great for when the presentation of the image might be conditional and you don’t want to waste time loading the image unless its required.
The following code example demonstrates the creation of the <img> element dynamically, loading it with a photo of an iceboat. When the image is loaded, the drawImage() method is called, and the image is passed in as the first argument.
function drawImage() {
    // var canvas = document.getElementById('myCanvas');
    var canvas = document.createElement('canvas'),
        ctx = canvas.getContext('2d');

    canvas.id = 'myCanvas';
    canvas.width = 800;
    canvas.height = 600;
    document.body.appendChild(canvas);

    var img = new Image();
    img.src = './assets/images/full-size/IceBoat.jpg';
    img.onload = function() {
        ctx.drawImage(img, 0, 0);
    };
}
The image is drawn at its native width and height. if the image is larger than the canvas , it’s clipped.
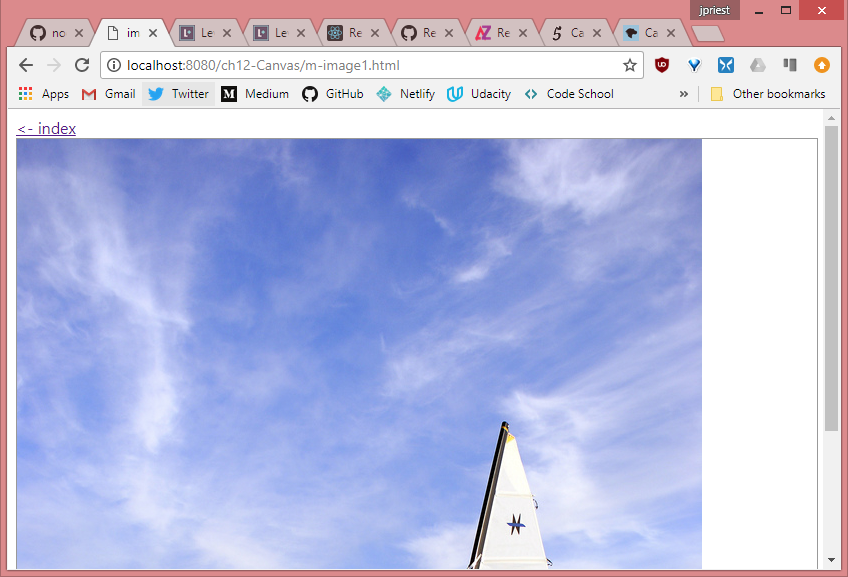
Live sample: https://james-priest.github.io/node_samples/ch12-Canvas/m-image1.html
You might need to control the size of the drawn image. Specify this with two more arguments when calling the drawImage() method, the width and height. Here width is set to 300 and height is set to 448.
function drawImage() {
    // var canvas = document.getElementById('myCanvas');
    var canvas = document.createElement('canvas'),
        ctx = canvas.getContext('2d');

    canvas.id = 'myCanvas';
    canvas.width = 800;
    canvas.height = 600;
    document.body.appendChild(canvas);

    var img = new Image();
    img.src = './assets/images/full-size/IceBoat.jpg';
    img.onload = function() {
        ctx.drawImage(img, 0, 0, 300, 448);
    };
}
When setting the width and height, you should try to maintain the proportions of the image to prevent skewing.
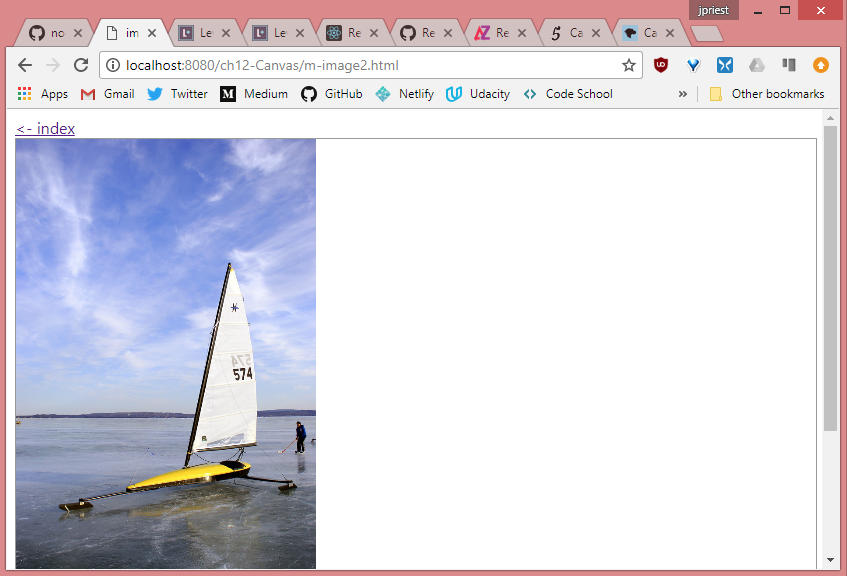
Live sample: https://james-priest.github.io/node_samples/ch12-Canvas/m-image2.html
Keep in mind you can draw your image and then overlay other shapes as necessary.
function drawImage() {
    // var canvas = document.getElementById('myCanvas');
    var canvas = document.createElement('canvas'),
        ctx = canvas.getContext('2d');

    canvas.id = 'myCanvas';
    canvas.width = 800;
    canvas.height = 600;
    document.body.appendChild(canvas);

    var img = new Image();
    img.src = './assets/images/full-size/IceBoat.jpg';
    img.onload = function() {
        ctx.font = 'bold 24pt Arial';

        ctx.drawImage(img, 120, -170, 450, 673);

        ctx.strokeStyle = 'black';
        ctx.lineWidth = 2;

        ctx.beginPath();
        ctx.moveTo(400, 180);
        ctx.lineTo(329, 180);
        ctx.stroke();
        ctx.strokeStyle = 'white';
        ctx.lineWidth = 1;
        ctx.textAlign = 'right';
        ctx.textBaseline = 'middle';
        ctx.fillText('Mast', 325, 180);
        ctx.strokeText('Mast', 325, 180);

        ctx.strokeStyle = 'black';
        ctx.lineWidth = 2;
        ctx.beginPath();
        ctx.moveTo(455, 120);
        ctx.lineTo(496, 120);
        ctx.stroke();
        ctx.strokeStyle = 'white';
        ctx.lineWidth = 1;
        ctx.textAlign = 'left';
        ctx.textBaseline = 'middle';
        ctx.fillText('Sail', 500, 120);
        ctx.strokeText('Sail', 500, 120);

        ctx.strokeStyle = 'black';
        ctx.lineWidth = 2;
        ctx.beginPath();
        ctx.moveTo(304, 294);
        ctx.lineTo(430, 294);
        ctx.stroke();
        ctx.strokeStyle = 'white';
        ctx.lineWidth = 1;
        ctx.textAlign = 'right';
        ctx.textBaseline = 'middle';
        ctx.fillText('Boom', 300, 290);
        ctx.strokeText('Boom', 300, 290);
    };
}
Here the results.

Live sample: https://james-priest.github.io/node_samples/ch12-Canvas/m-image3.html
22. Lesson Summary
- The
<canvas>element is new in HTML5 and provides a drawing context that is accessible using JavaScript. - Use the
getContext()method on the<canvas>element to get a reference to the context object. - Use the
fillRect()andstrokeRect()methods to draw rectangles. - Methods that start with fill are used to fill the shape with the value of the
fillStyleproperty. thefillStyleproperty can be set to a color, gradient, or pattern. - Methods that begin with stroke create an outline of the shape with the value of the
strokeStyleproperty. ThestrokeStyleproperty can be set to a color, gradient, or pattern. - The context object’s properties can be pushed onto a stack by using the
save()method or popped from the stack using therestore()method. - Use paths to create complex shapes using lines, rectangles, and arcs.
- Use the
fillText()andstrokeText()methods to draw text on the canvas. Use thedrawImage()method to draw images on the canvas.